.svg)


.svg)


As cyber threats evolve, organizations face an ever-increasing challenge to protect their systems and networks. Many organizations are turning to new methodologies to understand and mitigate these threats. Attack Path Visualization is one such methodology that has emerged as an effective defense strategy.
This approach is reshaping how organizations understand their vulnerabilities and prepare their defenses. It's not just about identifying isolated vulnerabilities or weak points anymore; it's about understanding how adversaries can chain these weak points to create a critical attack path to reach your crown jewels like domain admins, critical databases, Active Directory Domain Controllers, etc.
In this blog, we have delved into the details of attack path visualization, its significance for organizations, how it helps identify potential threats, and its practical applications.
However, before delving into Attack Path Visualization, if you're interested in learning more about what constitutes an Attack Vector and Attack Path Validation, read our comprehensive blogs.
.png?width=170&height=121&name=kerberoasting-banner-image-edited%20(1).png)
Uncover the Attack Paths Targeted by Kerberoasting
Try the interactive experience and identify high-risk routes.
What Is Attack Path Visualization?
The attack path visualization is a graphical representation of possible attack paths that an adversary could take to compromise an asset from any entry point on the target system. For example, once an attacker gains an initial foothold into your organizational environment, the attack path shows the potential route the adversary can take between the assets to reach your crown jewels like Domain Controllers.
Why Is Attack Path Visualization Important in Cybersecurity?
Attack Path Visualization is essential in modern cybersecurity due to several compelling reasons.
In an environment hosting a considerable number of assets, the potential for numerous attack paths becomes an inherent reality. However, it's vital to acknowledge that not every attack path poses the same level of risk, nor is each asset of equivalent significance.
Consider the analogy of a chess game. Every piece on the board has a unique role. In an ideal scenario, protection of every piece would be your strategy. However, in practicality, prioritization becomes a necessity. For instance, the king in a chess game holds critical importance, while pawns, though valuable in their strategy, can often be considered expendable. Drawing parallels in the digital realm, all assets do not possess equal value. A critical database storing sensitive customer data is significantly more valuable compared to a routine desktop computer.
Attack Path Visualization provides a comprehensive 'map' detailing the potential routes an attacker could traverse to navigate the network, thus highlighting the steps that could lead to the compromise of critical assets. Instead of concentrating on isolated vulnerabilities, this visualization links these vulnerabilities, showcasing the probable journey an attacker might undertake from exploiting a less valuable asset to eventually compromising a high-value target.
The major advantage of attack path visualization is that it allows cybersecurity professionals to identify the most plausible routes an attacker might take. More importantly, it provides insights into the most critical paths leading to the highest value assets. Such knowledge is indispensable when planning and prioritizing cybersecurity measures.
Instead of trying to remediate all vulnerabilities with equal urgency, security teams can focus their efforts on the high critical attack paths and secure their organizational crown jewels, such as a Domain Admin account.
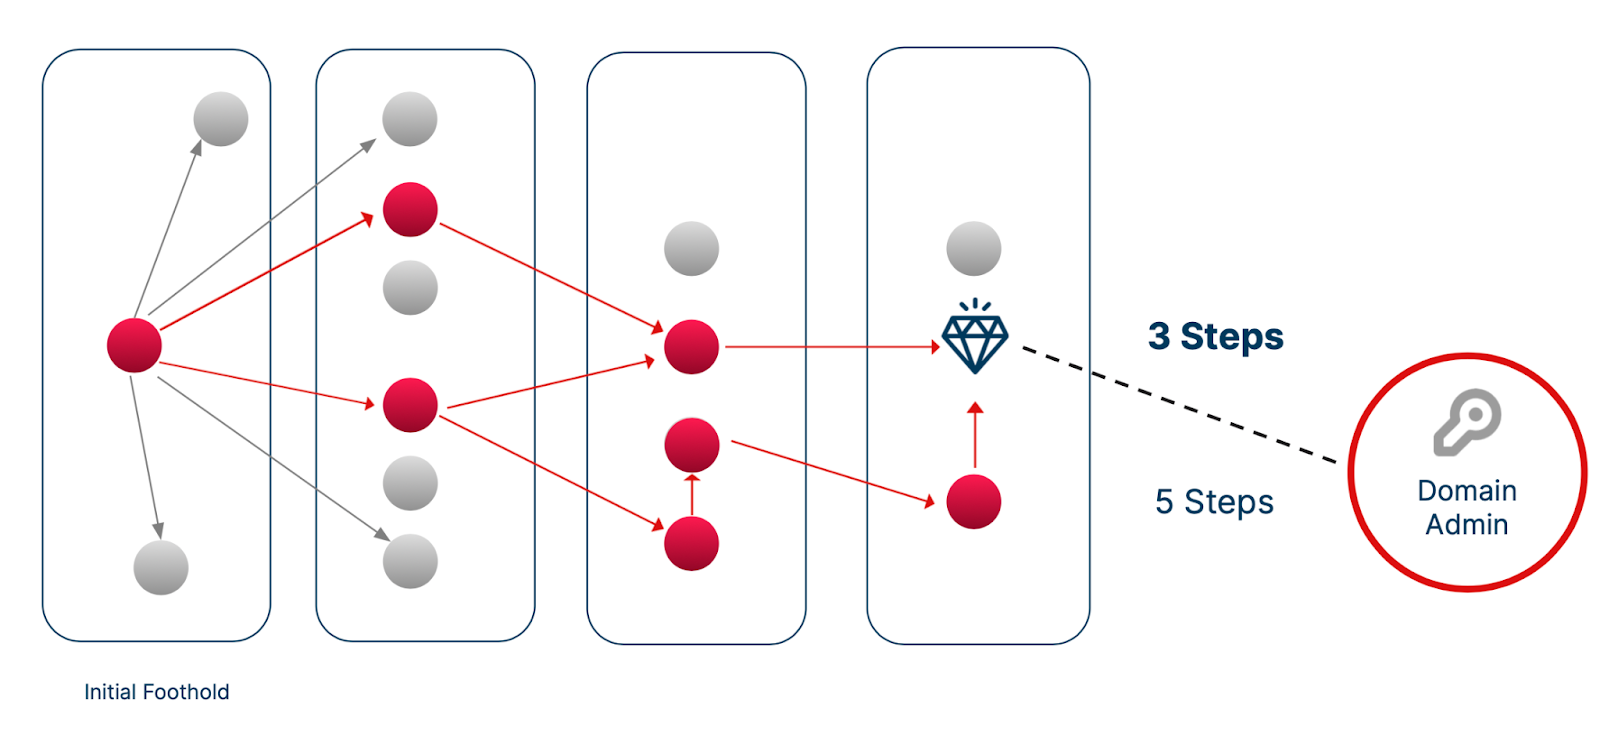
Figure 1. Visualization of an Attack Path to a Domain Admin Account.
Thus, attack path visualization strategy not only aids in better resource allocation but also enhances the overall cybersecurity posture of the organization.
How Does Attack Path Visualization Help Security Teams?
Attack Path Visualization can greatly assist in identifying potential threats, as it offers an in-depth understanding of possible breach points and exploitable vulnerabilities within an organization's network.
Attack Path Visualization can demonstrate how attackers might misuse protocols like Windows Management Instrumentation (WMI), Server Message Block (SMB), and Remote Desktop Protocol (RDP) for lateral movement. For instance, it can reveal potential paths where an attacker might hijack a remote service session or leverage valid accounts to gain unauthorized network access.
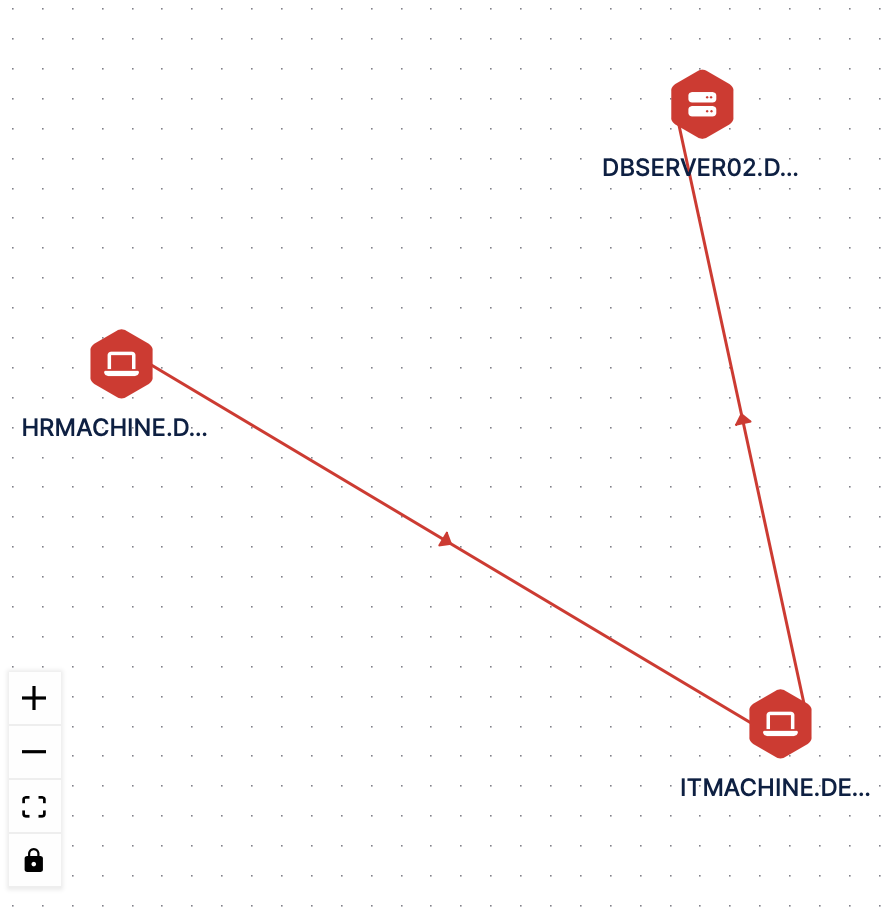
Figure 2. Graphical Representation of an Example Attack Path by Picus Attack Path Validation.
-
Example Scenario: Misusing Protocols and Active Directory Enumeration
In the figure provided above, we observe the sequence of steps an adversary takes, visualized via Attack Path Visualization. Initially, the adversary enumerates users and services on HRMACHINE.DEMO.LOCAL, identifies vulnerabilities, and escalates privileges to gain system-level access. They then exploit the Server Message Block (SMB) to execute commands on ITMACHINE.DEMO.LOCAL, using credentials previously harvested from HRMACHINE.DEMO.LOCAL. After establishing control over ITMACHINE.DEMO.LOCAL, the adversary performs further credential dumping and Active Directory enumeration. With the accumulated credentials and knowledge of the network, they subsequently gain access to DBSERVER02.DEMO.LOCAL via SMB execution. The attack path effectively demonstrates how the adversary progressively escalates privileges and moves laterally across the network.
Attack Path Visualization plays an essential role in enabling security professionals to understand how an attacker might chain together different vulnerabilities and perform Active Directory enumeration, ultimately leading to the compromise of critical databases. This visualization provides a step-by-step pathway an attacker might follow, making it easier to anticipate and counter potential attacks.
Therefore, Attack Path Visualization is not merely a passive tool for identifying vulnerabilities but a proactive measure for security hardening. By demonstrating the possible actions an attacker can take in an Active Directory for enumeration, it allows organizations to reinforce their defenses against these threats in advance. In essence, Attack Path Visualization enhances an organization's cybersecurity strategy, turning insights into action for robust defense planning.
-
Example Scenario: Insider Threats with VPN Access to Internal Network
Attack Path Visualization can be also used to identify the potential attack paths that a rogue employee might traverse to compromise an organization from within. It allows an organization to see potential threats and weaknesses that an insider might exploit, helping them to put in place stronger internal security controls and detect anomalies that might signify an insider attack.
For instance, Attack Path Visualization can help identify how an employee might exploit a remote worker's VPN access to infiltrate an organization's internal network. This scenario also mirrors a situation where an adversary could use stolen VPN credentials from a remote employee. Once inside, they can exploit vulnerabilities and employ lateral movement techniques to access critical assets. Attack Path Visualization simulates this process, outlining potential pathways an attacker might pursue, including the exploitation of weak Active Directory configurations or the use of OS Credential Dumping (ATT&CK T1003) attack techniques to gain unauthorized access to accounts that facilitate pivoting.
By understanding these possible attack paths, organizations can proactively establish defenses to counter these threats.
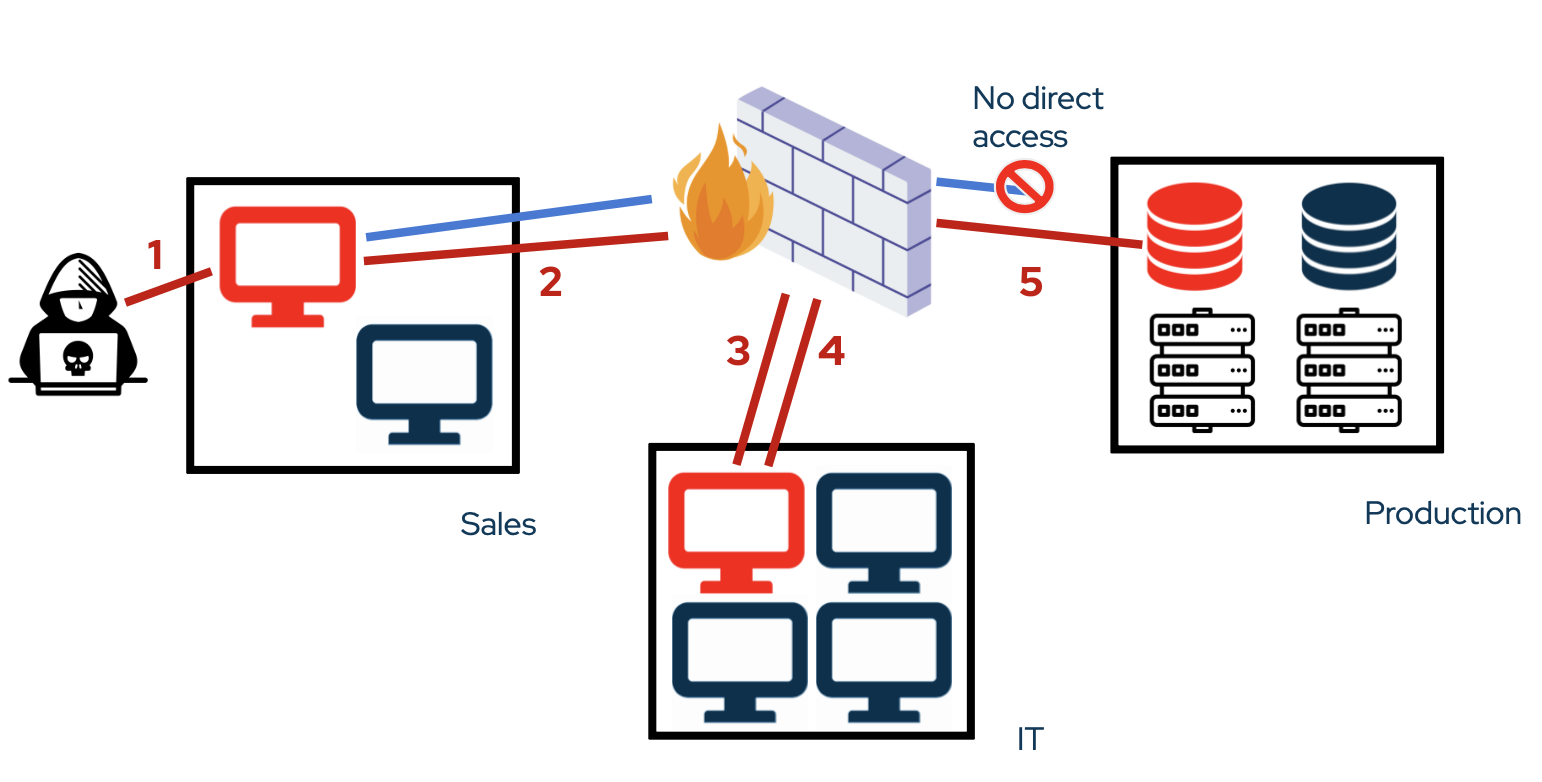
Figure 3. Attack Paths that Emerge due to the Remote Working.
By utilizing solutions like Picus Security's Attack Path Validation module, organizations can visualize and understand these potential attack paths. This tool enables swift and efficient identification of internal security gaps and offers opportunities for proactive threat mitigation.
How Does Attack Path Visualization Contribute to the Risk Assessment Process?
Attack path visualization is an invaluable tool in the risk assessment process by illuminating the potential vulnerabilities in an organization's network infrastructure. By simulating the techniques employed by threat actors and visualizing their pathways through network systems and services, such as through domain enumeration or LSASS credential dumping, security teams can effectively identify the possible routes an adversary might take to compromise the network.
The visualization of these pathways, including the misuse of Group Managed Service Accounts (gMSA) or Local Administrator Password Solution (LAPS), helps organizations identify and address misconfigurations or vulnerabilities that could be exploited. These visual maps, which may also highlight potential attack vectors such as modifiable service escalation or Windows Management Instrumentation (WMI), provide crucial insights into possible privilege escalation or unauthorized system access.
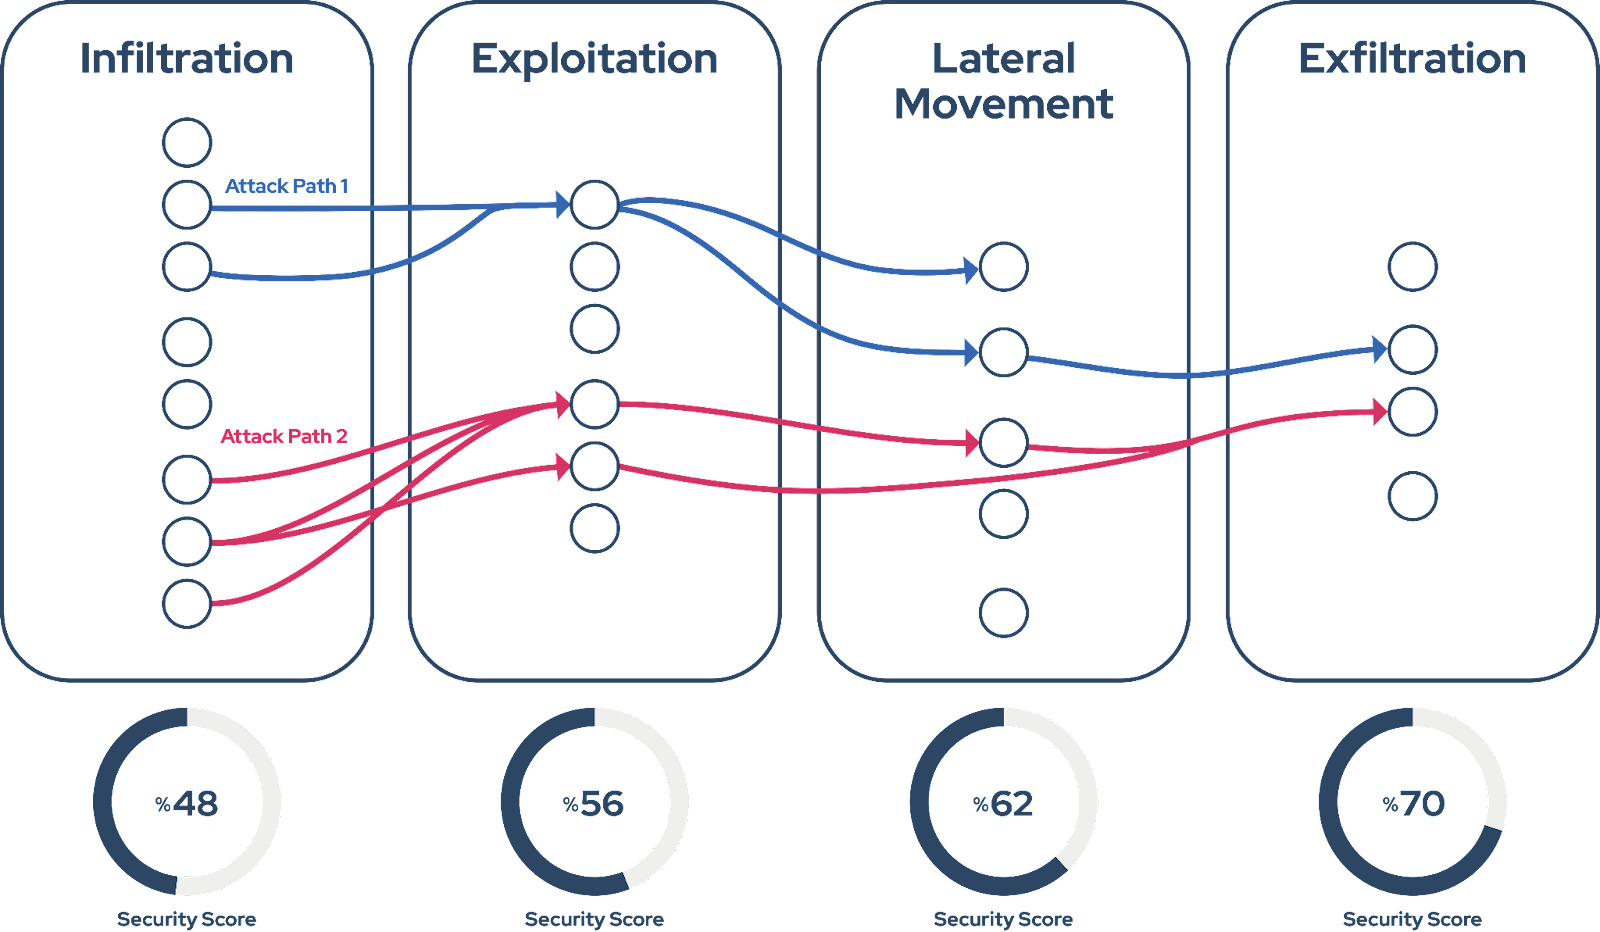
Figure 4. Visualization of Critical Attack Paths.
The act of visualizing these attack paths is not merely a passive observation. It is a critical component of risk assessment that informs the organization's understanding of its security landscape and aids in the prioritization of remediation efforts. By revealing the most critical vulnerabilities, attack path visualization enables organizations to allocate resources effectively and take a proactive approach to their security strategy.
The power of attack path visualization is further underscored when it uncovers less obvious, but no less potent threats. Techniques like 'Pass the Ticket' or 'Over Pass the Hash' can allow an adversary to gain unauthorized access, and visualizing these paths provides the opportunity to understand the steps an adversary might take and implement necessary countermeasures.
In essence, attack path visualization plays a critical role in risk assessment, casting light on potential vulnerabilities, illuminating the paths an adversary might take, and providing the foundation for a proactive, informed security strategy.
Can Attack Path Visualization Be Automated? If So, What Tools Are Available for This?
Attack Path Visualization can indeed be automated and there are numerous tools in the market that can assist with this process.
Automating Attack Path Visualization entails simulating possible attack paths that an advanced adversary might take to infiltrate and compromise a network. This is typically achieved using a sophisticated algorithm or a decision engine that evaluates the network's vulnerabilities and chooses the most efficient and stealthy way to simulate a chain of adversary actions. The objective here is to reach a predetermined goal, emulating the strategies of a real attacker.
One of the techniques used for this purpose involves creating a weighted graph-based model of the network. In this model, the nodes represent the individual components of the network, such as servers or client machines, while the edges signify the possible attack vectors or techniques that an adversary might use for lateral movement within the network. The "weight" assigned to each edge represents a scoring mechanism based on several factors like the level of stealthiness of the attack technique, its likelihood of success, its potential for detection, and the value of the targeted asset. This weighted score helps the decision engine select the most effective and least detectable attack path, thus imitating the thought process of a sophisticated attacker.
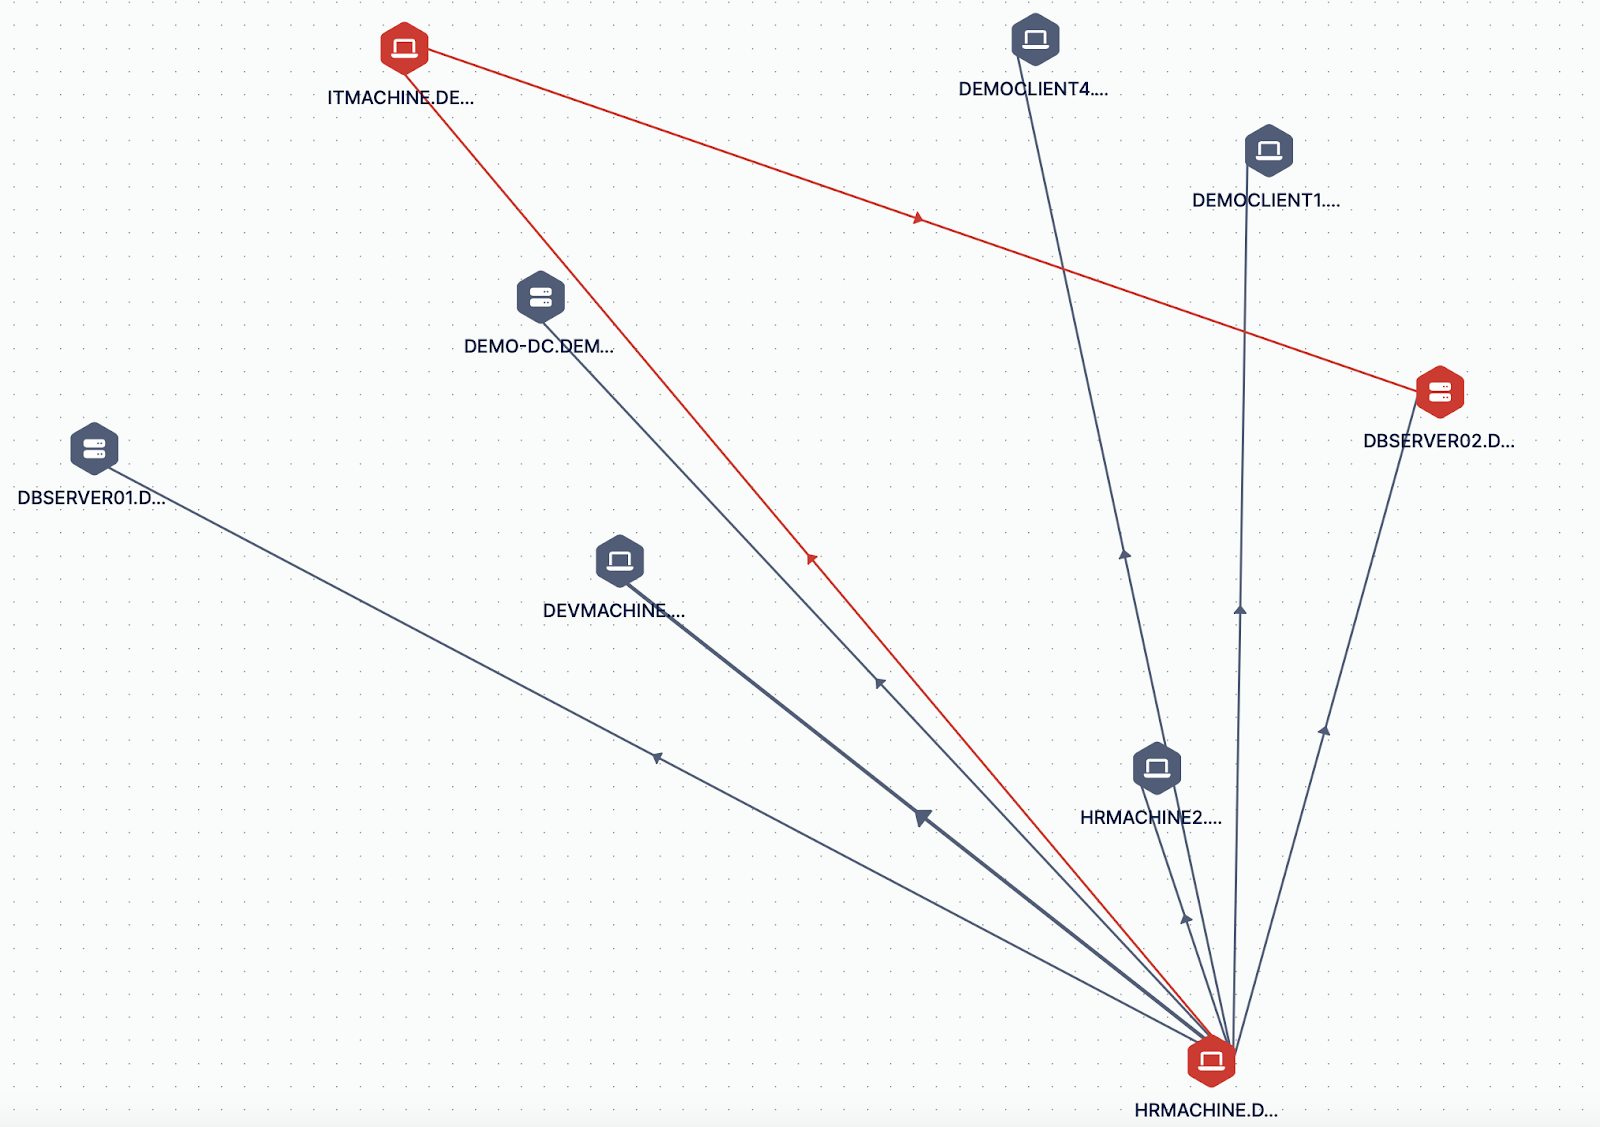
Figure 5. Attack Path Visualization with Picus’ Attack Path Validation module.
For instance, the red lines in the figure above depict a successful attack path's mini-map. It shows how an adversary, upon gaining initial foothold in an HR network segment, moves to another host in IT. Using the privileges of an IT account, they gain access to database server 02.
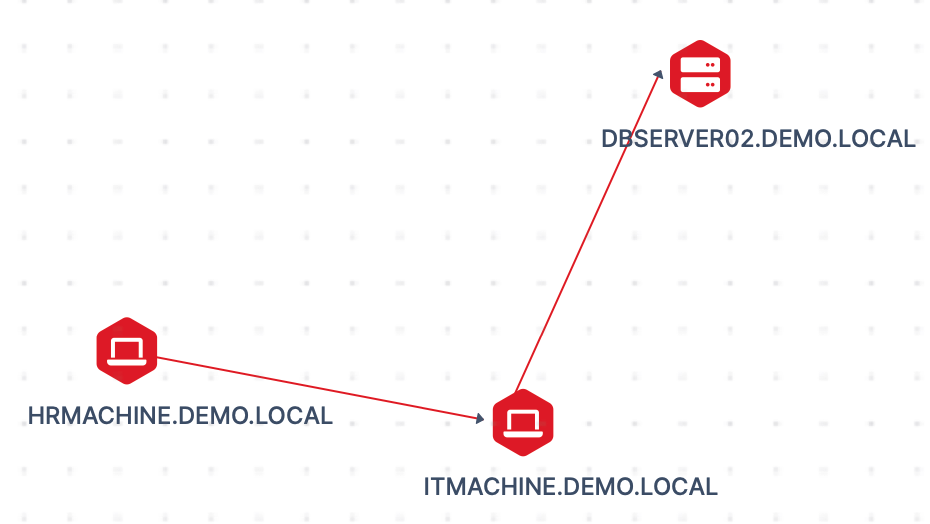
Figure 6. Attack Path Visualization of a Successful Lateral Movement Attack.
Another significant aspect of automated Attack Path Visualization tools is the emphasis on objective-based attack simulation. Rather than randomly targeting every vulnerability, the tool works based on predefined objectives, such as compromising a specific machine or network segment, accessing a Domain Controller in the Active Directory, or harvesting domain user credentials and NTLMv2 hashes. This ensures that the simulated attacks reflect the strategic, goal-oriented nature of real-world threat actors.
In terms of maintaining stealthiness during the simulation, these automated tools often use fileless or in-memory attacks, which closely mimic the tactics of advanced threat actors and help bypass various security controls. Any additional tools or malicious binaries needed for the simulation are often downloaded directly into memory from a remote Command and Control (C2) server, further avoiding detection by security systems.
In this respect, the attack path validation module developed by Picus Security aligns perfectly with this approach. It uses an intelligent, graph-based, objective-oriented model with a focus on stealth to visualize attack paths. It's specifically designed to help organizations identify hidden vulnerabilities and critical attack paths within their network, enabling them to strengthen their security posture and proactively guard against threats.
To talk to an expert or read the data sheet, visit the product page for the Picus Attack Path Validation.