.svg)


.svg)


Atlassian is a software company that offers popular collaboration and project management tools. The products such as Jira, Confluence, Bitbucket, and Trello help your various business processes. These products generate a lot of log data as they manage different facets of your business.
Atlassian products play an important role in managing various business processes and facilitating collaboration for your organization. These products help you plan projects, create and store documentation, develop software, and collaborate effectively. Additionally, Atlassian's products may store sensitive company and customer data. As a result, security is becoming an important issue covering data confidentiality and integrity, and the security of Atlassian, which we use in our organization's business processes, can be extremely critical.
Maintaining uninterrupted business processes is a top priority for organizations. Ensuring the security of Atlassian platforms is essential, not only to uphold customer trust but also to safeguard business continuity. Security breaches or malicious attacks can be extremely detrimental to Atlassian's functionality. This shows us how important strong security measures are.
In this blog post, we will explore how to transfer the logs of Atlassian platforms to Splunk and how utilizing this data can enhance the security and performance of your business.
Test Your Detection Coverage with Picus Platform
Splunk and Its Mission
Splunk is a platform that provides big data analysis and log management. Splunk collects the logs, indexes them, and provides a search engine and syntax so you can review them. The organizations can visualize their data and handle security and operational issues with Splunk. You can also create your own detection rules to identify anomalies. Leveraging the power of Splunk, we will collect logs from Atlassian products and create anomaly detection rules.
Collecting the Atlassian Logs on Splunk Environment
Atlassian, like many other cloud products, can integrate with log management applications. Through this integration, we can easily manage Atlassian's logging capabilities within Splunk.
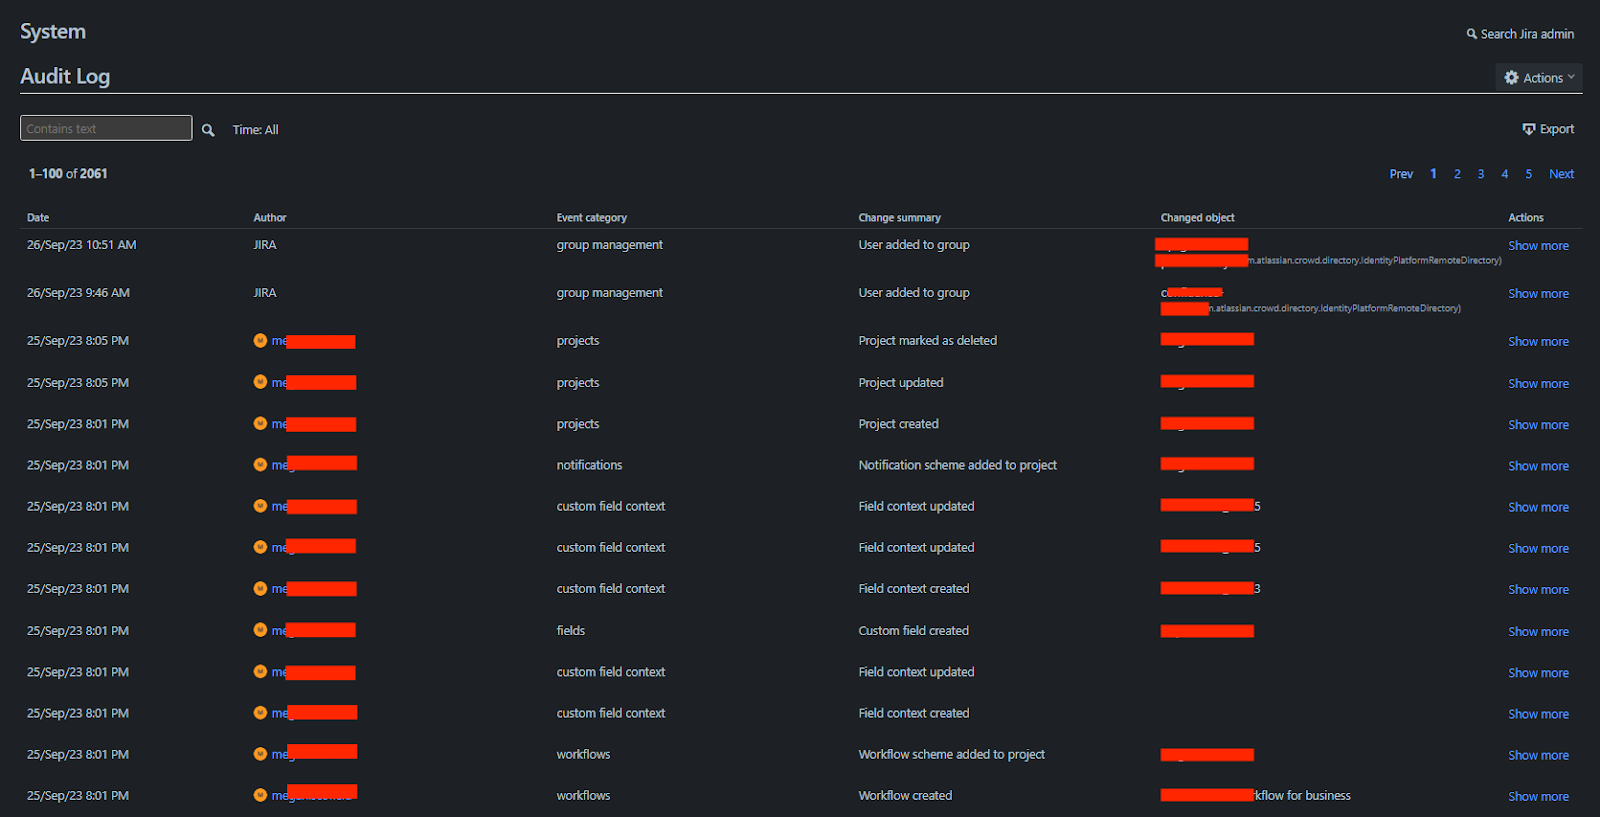
Figure 1: Atlassian Audit Logs
To pull our logs into Splunk, we will use an API Token from Atlassian and the Jira Add-On in Splunk. Let's begin by creating an API Token for Splunk in Atlassian. You can do this by visiting https://id.atlassian.com/manage-profile/security/api-tokens.
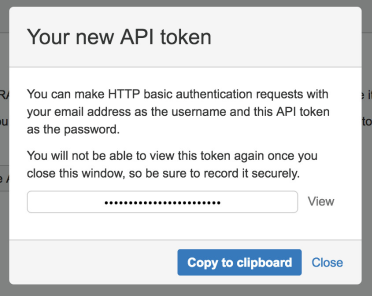
Figure 2: Create new API Token on Atlassian
In Splunk, we will receive logs from Atlassian using the "Splunk Add-on for Jira Cloud" extension. To do this, we first need to enter the API Token we created on Atlassian in the Configuration tab of our app.
(Note: Ensure you have the necessary permissions and access rights to configure the app and add the API Token.)
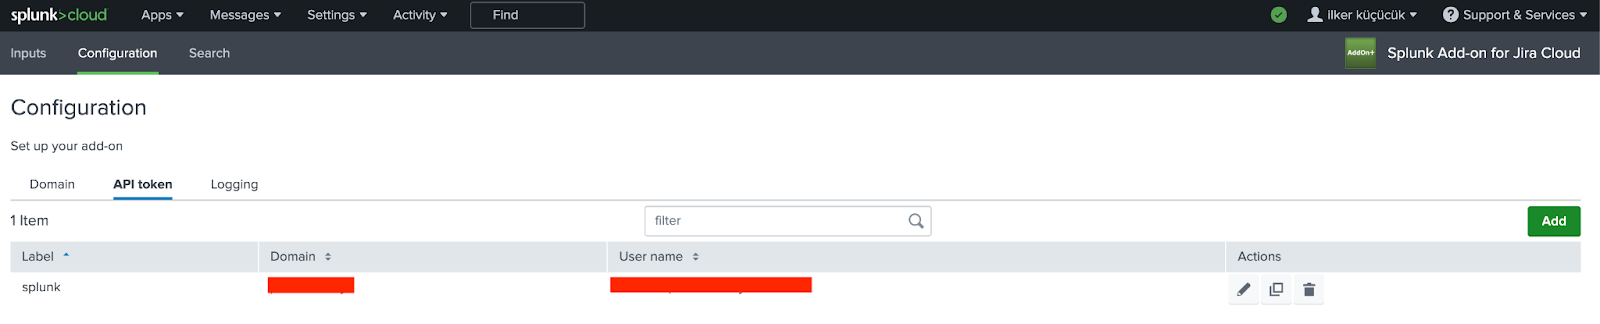
Figure 3: Splunk Add on for Jira Cloud
After determining our domain information and logging level, we can proceed to the "Inputs" tab. In the "Inputs" tab, to set up the flow and storage of our data, we need to utilize the "index" structure in Splunk. To do this, follow these steps within Splunk:
-
Navigate to "Settings > Indexes."
-
Click on the "New Index" button.
-
In this section, provide information such as the data type your index will hold, the maximum raw size of stored data, and the retention period. (In our example, our index is named "atlassian," and the data type selected is "Events.")
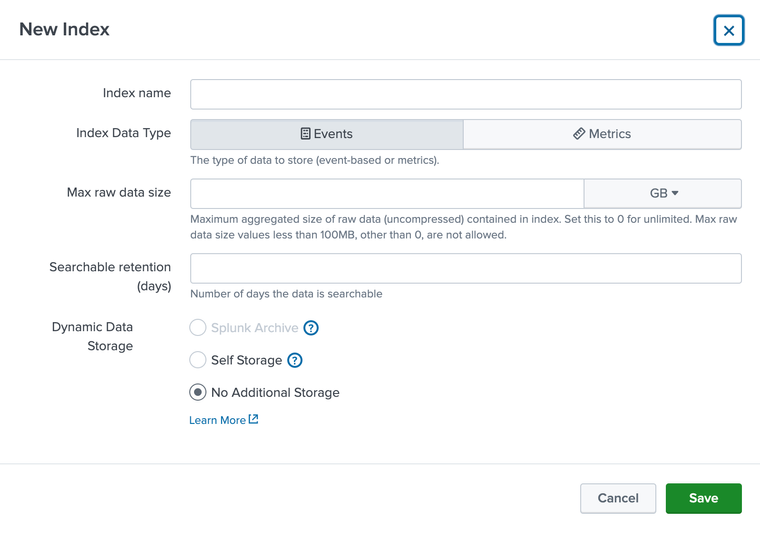
Figure 4: Create an Index
Now that we've determined where the incoming data will be stored, it's time to introduce this "index" to our Jira App.
- Navigate to the "Inputs" tab in the Jira App.
- With the "Create New Input" option.
Then, you'll be ready to start reviewing logs!
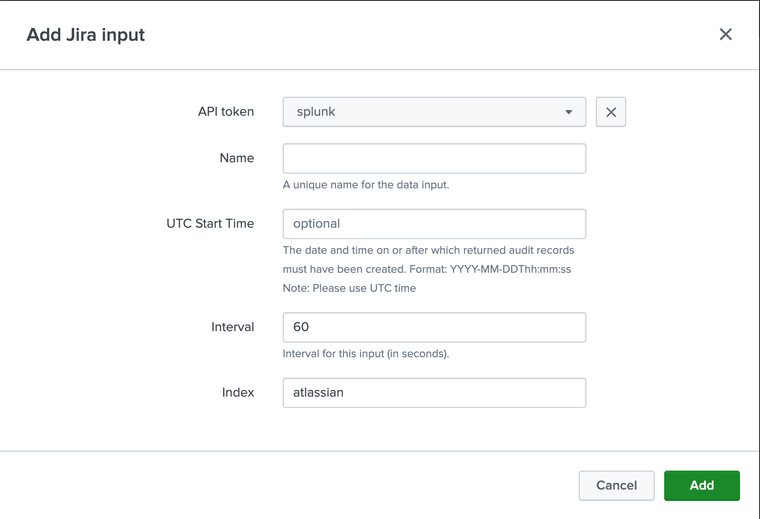
Figure 5: Create an Input
A Quick Review of the Atlassian Logs
When we want to examine the structure of the logs, we can see that all event types on Atlassian are neatly gathered in the "summary" field. Knowing that the individuals triggering these events are found in the "authorkey", and the entities or objects affected by the triggered events are within the "associatedItems" field will simplify our rule-writing process. Additionally, we can access a wealth of information, including the projects where events occur, pages, the IP addresses of users performing events, user roles, and authorization levels, among many others.
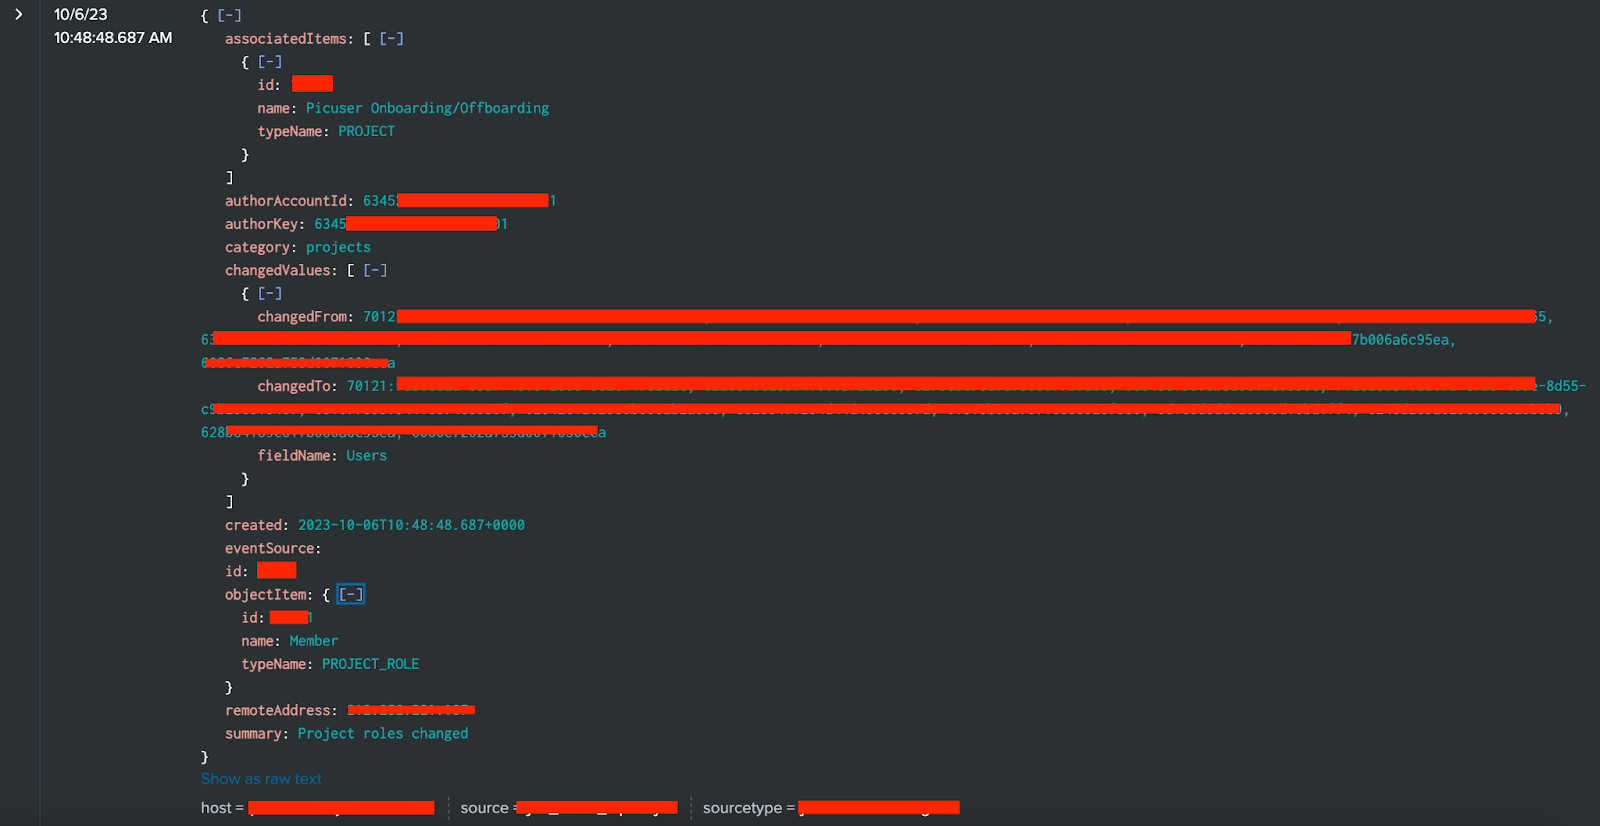
Figure 6: an Example Log
The structure of logs can vary depending on the event types. For example, in some event types, the "associatedItems" field may indicate a user, while in others, it may represent a page name or a project name. To effectively utilize the logs, it's beneficial to review all fields when creating the scenarios you want to detect.
Rule Development
After reviewing our logs, you can now create various scenarios that you identify as potential risks and areas of interest in your Atlassian environment. Based on our frequency of Atlassian usage and our past findings, we want to investigate and monitor the following situations:
Use Cases
-
The creation of an external user in Atlassian.
-
The deletion of a project in Atlassian.
-
Adding any user to an Admin-level user group.
-
Removing a user from a project.
-
Changing a user's password (As we authenticate through our Google accounts, this could be noteworthy for us).
While creating rules for the scenarios we want to investigate, we will follow the following process:
-
Create the rules in Splunk.
-
Enrich the alerts in Jira's automation before adding them as tasks.
-
Transfer the alerts to the board in Jira.
This process aligns with the "detection as code" methodology, where detection rules are treated as code to enhance consistency, scalability, and efficiency in managing threats. By implementing detection as code, security teams can ensure reusable and automated processes for monitoring potential risks.
If you wish to review the alerts on Jira, you can establish integration between Splunk and Jira using Splunk's 'JIRA Service Desk Simple AddOn.
As shown in the image below, you can add your Jira account to Splunk by providing the Jira URL, Username, and API Token information to the add-on. You will be able to select your desired Jira project where you want to view the alarm outputs when creating Splunk rules.
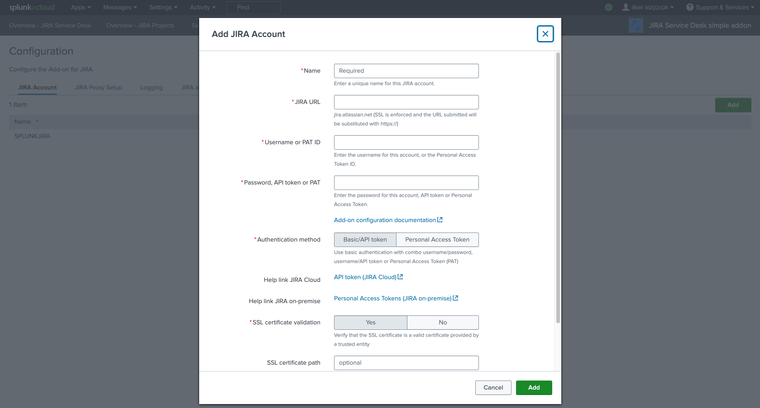
Figure 7: Add JIRA Account
After completing the integration, you can start creating your rules in Splunk by navigating to the Settings > Searches, Reports, and Alerts tab, where you manage your rules.
Use Case 1- External User Created
Scope: This rule is triggered when a user is created on Atlassian with an email address from outside our domain. The creation of external users on Atlassian is a critical matter that warrants investigation. Given that Atlassian houses our company's business processes, sensitive customer data, plans, and projects, it is extremely perilous for an external user to potentially access this information through any vulnerability or misconfiguration. The Atlassian groups to which these users belong and the permissions they possess should be carefully considered.
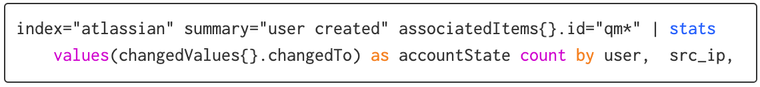
Figure 8: Splunk Search Query of Rule
- In the "User Created" event type, the rule will extract and log the real-time status, user ID, and IP address of users. This type of user's user ID starts with "qm" (in our environment, this represents the ID given to an external user in Atlassian logs.
- You can investigate the scope of your rule while it runs for any time range using the "Time Range" and set the frequency of execution as desired (we use Cron Expression).
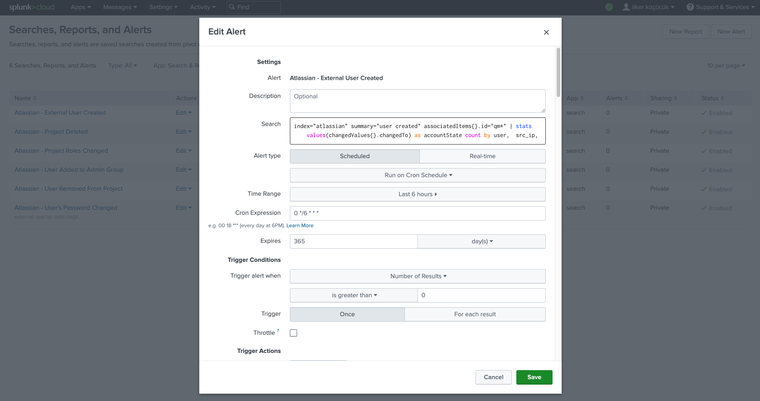
Figure 9: Configure the Alert
Our next step is to link our rule to a Jira Board. To do this, under "Trigger Actions", select "Open an issue in JIRA Service Desk" and configure the necessary settings based on your environment's priorities. (Note: Prior to this step, integration between Splunk and Jira must be established.)
- We choose our Jira account, the project where the alarm task will be created, the task location, and, optionally, the priority.
- In the "Description" field, we can determine how the output of our rule will appear.
- Note: This field can be written based on our search results. Therefore, our Splunk query should include the fields you want to display in the rule output.
- Fields should start with "$result$" and then include the field name from our search.
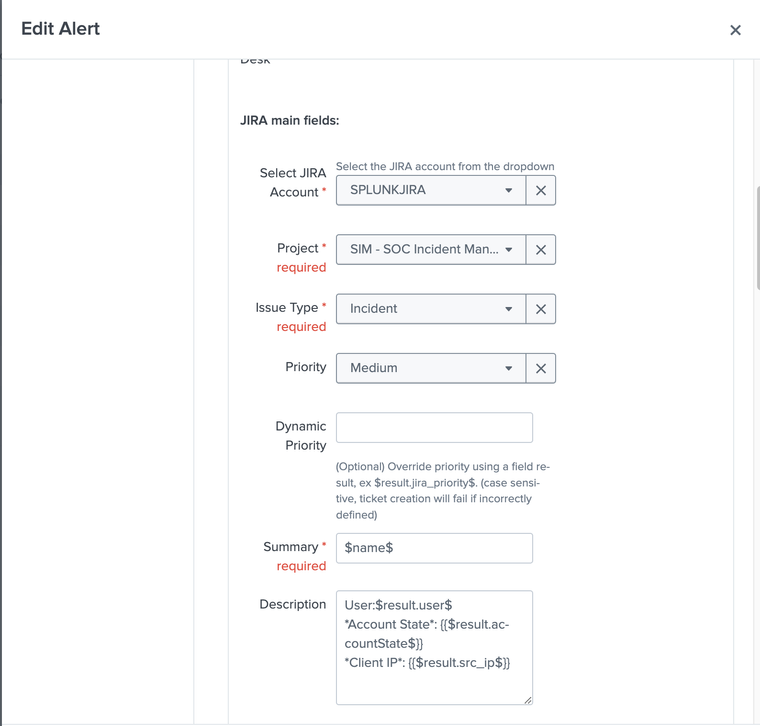
Figure 10: Create a Description
Now, we have created our first rule, but it should be in a disabled state for now. This is because we need to enrich our alerts. I will explain why enrichment is necessary in the next sections.
When creating our other rules, we will follow the same process, so I will only discuss their scope and configurations.
Use Case 2- Project Deleted
Scope: This rule is triggered when a project is deleted on Atlassian. Atlassian projects may contain various sensitive data belonging to the company, including R&D work, business processes, and even customer data. These pieces of information are stored on Atlassian for easy management. In the event of project deletion, it is crucial to obtain information about the reason for this action and who performed it.
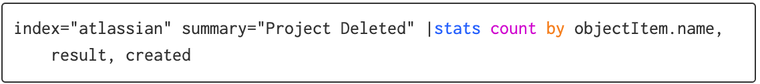
Figure 11: Splunk Search Query of Rule
- This alert prints the name of the deleted project and the timestamp of the log within the "Project Deleted" event type.
- Atlassian does not provide log information regarding who deleted the projects. However, you can obtain this information through an administrative-level configuration on Atlassian, which allows you to receive it via email.
Use Case 3- Project Roles Changed
Scope: This rule is triggered when Administrator privileges are granted to users on a project or when a user's permissions are elevated. Administrator privileges allow users to perform nearly all actions within a project. The creation of a malicious Administrator user can lead to malicious activities in user operations, project operations, and even logging processes. It is of utmost importance to be instantly informed when a user obtains Administrator privileges.
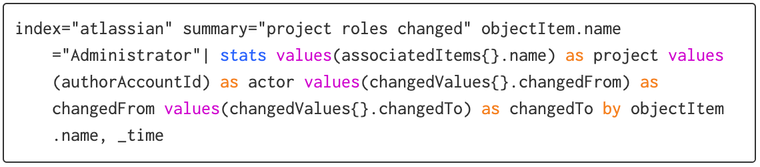
Figure 12: Splunk Search Query of Rule
- It searches within the "project roles changed" event type for events where "objectItem.name" is "Administrator" (for this event type, this field represents the permission level).
- To populate the rule, it retrieves information from the "actor" field for the person who made this change and the affected users from the "changedValues" variables.
- It also obtains the name of the project where the change was made from the "associatedItems.name" field.
- We recommend keeping the runtime of this alert in Splunk as short as possible.
Use Case 4- User Added to Admin Group
Scope: This rule is triggered when any user is added to specific admin-privileged groups. Atlassian role groups, in contrast to regular users, may possess permissions across multiple projects. Malicious users added to these role groups can potentially gain access to sensitive company data across different projects. Therefore, close monitoring of these groups is essential.
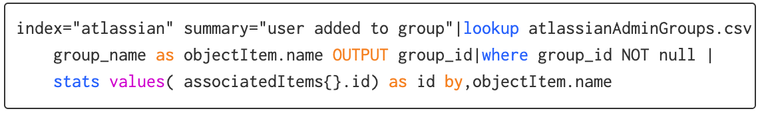
Figure 13: Splunk Search Query of Rule
- In this rule, unlike the others, a Lookup Table existing in Splunk is utilized. The predefined Administrator groups from the Lookup Table are added to Splunk Search to compare with the data in event logs. This way, it determines which groups where users are added will trigger an alert. The rule extracts from events with the Event Type "user added to group" which admin groups the users were added to, and prints the ID of the added user.
- We recommend keeping the runtime of this alert in Splunk as short as possible.
Use Case 5- User Removed From Project
Scope: This rule is triggered when a user is removed from a project on Atlassian. Detecting the removal of a user from a project is just as important as detecting when users are added to a project. Since Atlassian logs do not provide records of user additions to a project, we can investigate traces of suspicious activity through such actions when it is suspected that a user has engaged in suspicious activities.
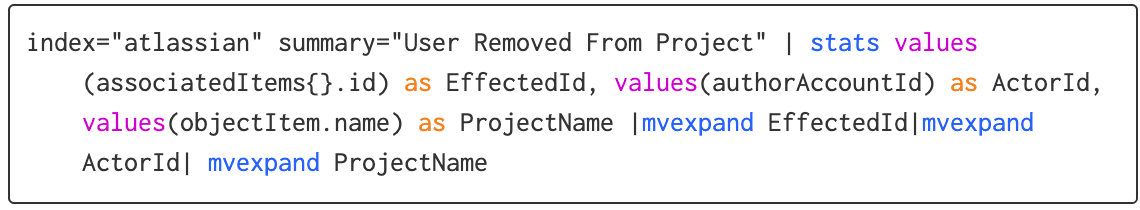
Figure 14: Splunk Search Query of Rule
- Splunk Search Query of Rule: The rule, within the "User Removed From Project" event type, extracts the ID of the user removed from the project, the ID of the person who removed the user, and the project from which the user was removed and prints them in the alert.
Use Case 6- User's Password Changed
Scope: This rule is triggered when the password of an internal Atlassian user is changed. In our environment, we use the Google OAuth system for logging into Atlassian. Therefore, a password change in Atlassian accounts is a situation that requires investigation for us. This is because such an event may indicate that an account has been compromised and the user is attempting to block unauthorized access.
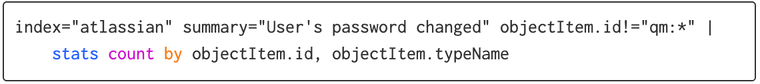
Figure 15: Splunk Search Query of Rule
- Within the "User's password changed" event type, the rule extracts the IDs and account types of internal users and prints them in the alert. Account types can be like customer, app, or user.
- Since our environment can include external users in Atlassian, we want to specifically examine internal users. Therefore, we applied a filter using the ID parameter.
When we activate the alarms, the triggered rules' alerts will appear as tasks in Jira.
For example, the view of the "Atlassian - External User Created" alarm in Jira looks like this:
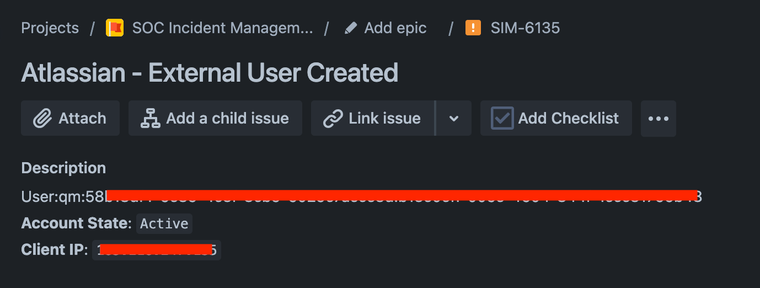
Figure 16: Output of the Rule
Missing Fields Can Cause Missing Visibility
As I mentioned earlier, when writing rules based on Atlassian logs, there is an important consideration to keep in mind. Atlassian logs can sometimes be insufficient for rule creation in certain aspects. For example, it may not always be possible to see the usernames or email addresses of users in the logs. In such cases, it can become challenging to review or interpret the alarms.
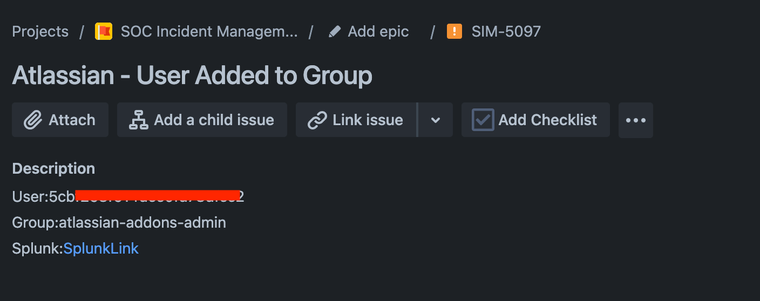
Figure 17: An Alarm with Inaccessible User Information
This is why, as mentioned earlier, we need to undertake an enrichment effort for alarms. During our enrichment process, we will use automation in Jira to communicate with the Atlassian REST API and retrieve the necessary information for us. This will enable us to enrich the alarm and print it to our Jira Board in an enhanced format for our review.
Alarm Content Enrichment by Jira Automation
Automation in Jira Service Management is a "no-code" capability that only takes a few clicks. By automating your processes and workflows, you can remove the manual, repetitive tasks, and you can focus on the prioritized work.
To create our automation, we start by clicking on the "Automations" tab in our project. We enter the details of our automation.
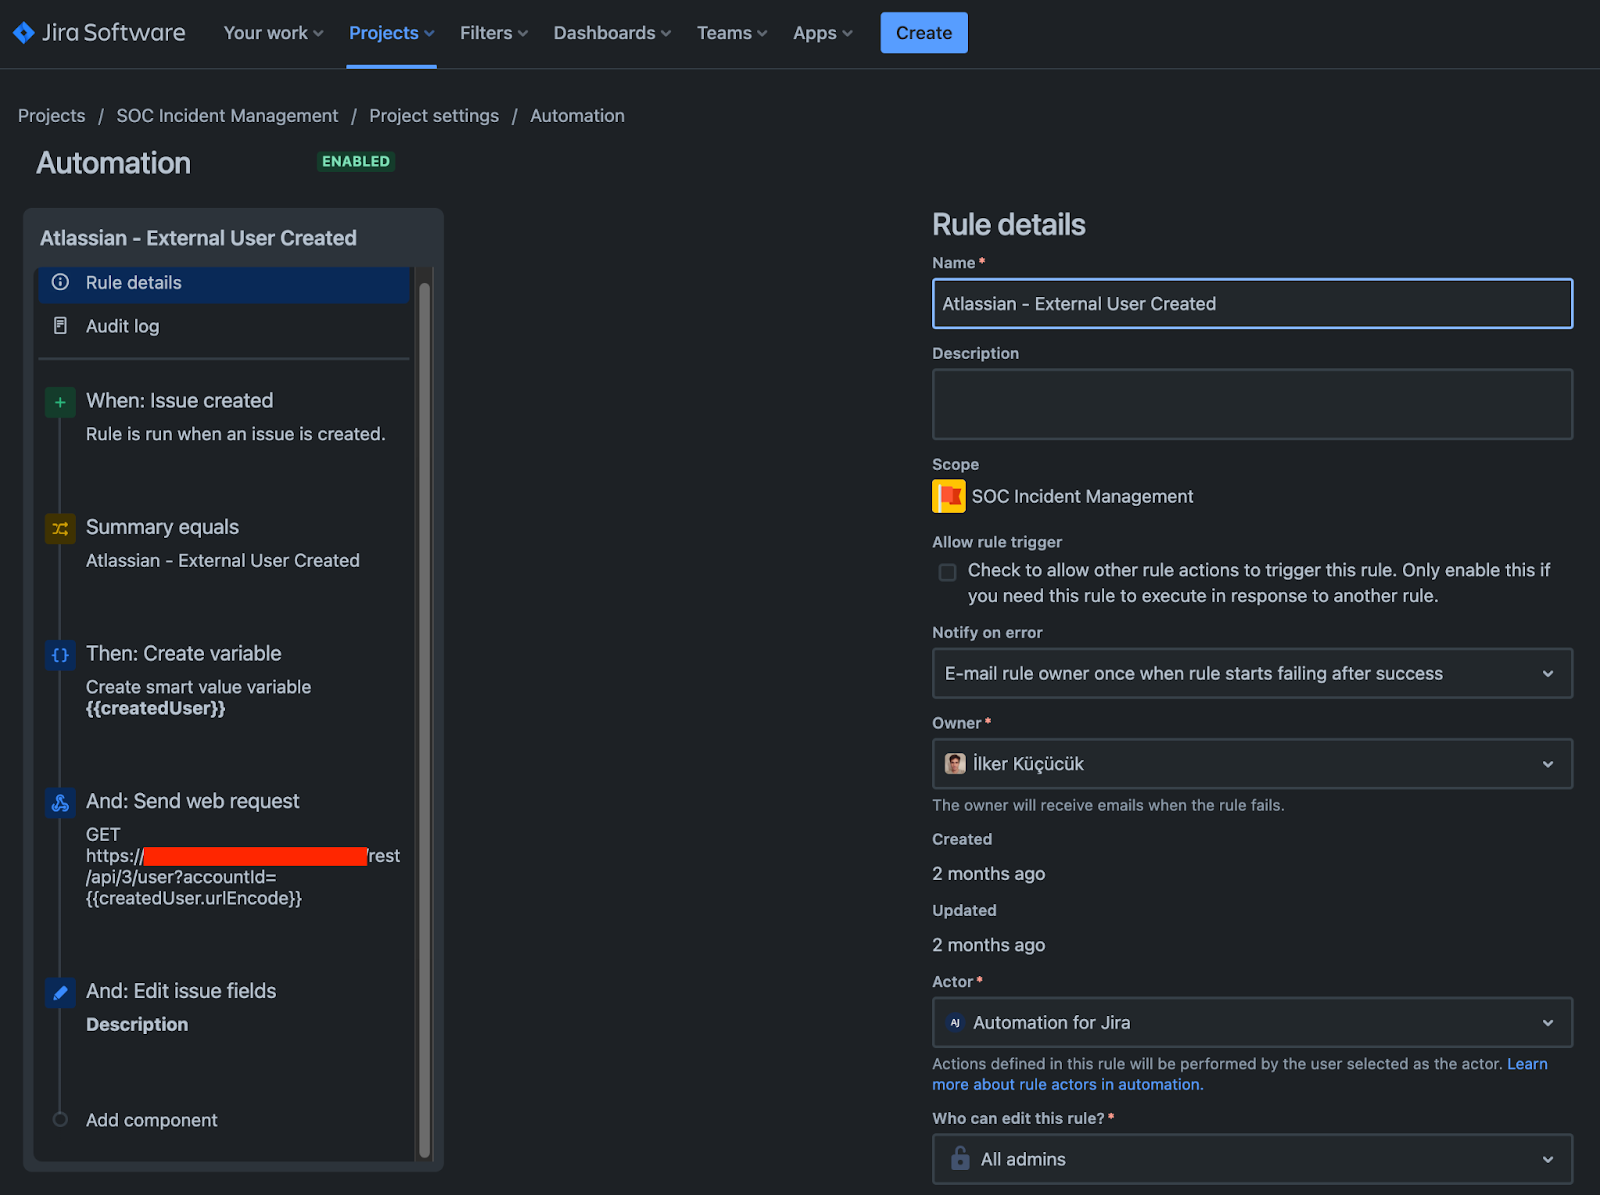
Figure 18: Configuring the Automation
- First, we select the condition in which our automation will be triggered. We have set it to trigger when an alarm is created in Splunk.
- We create a new "Summary Equals" condition. Then, we enter the name of our alarm, which we created on Splunk to capture the generated alarm.
- In the next step, we create a variable that we will use when communicating with the Atlassian REST API.
- When assigning a value to this variable, we will use regex to extract information from the fields in our Jira alarm.
- By providing a specific regex parameter to the issue.description.match function, we can obtain the value of our "User" field in the issue description.
- (What are smart values? | Cloud automation Cloud | Atlassian Support
With these Smart Values, you can manipulate all the data of an issue.)
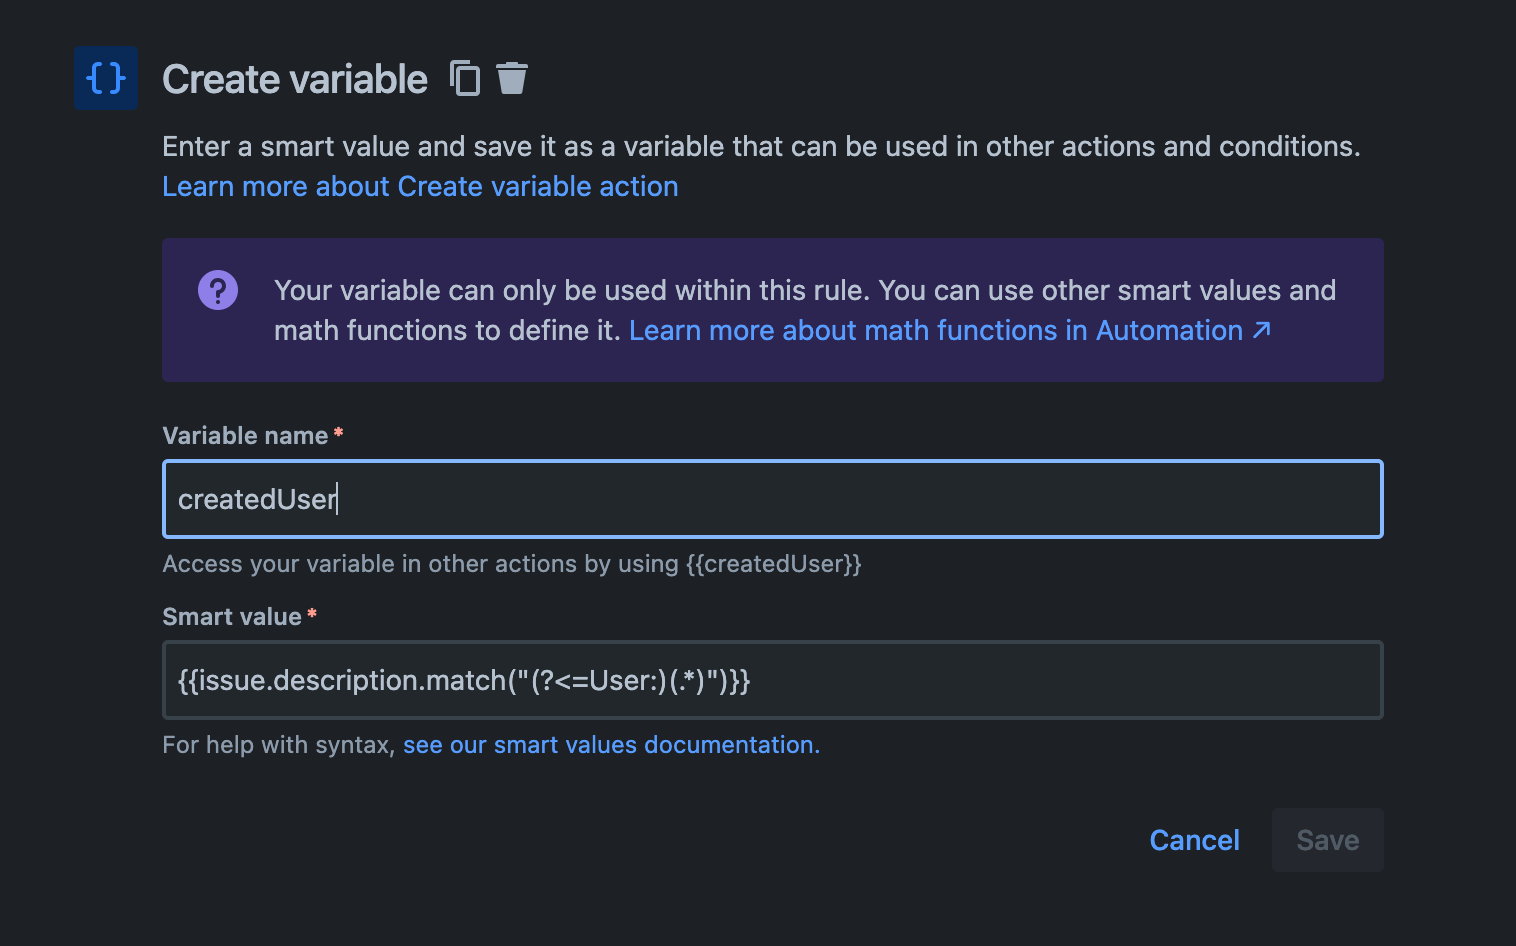
Figure 19: Creating a Variable for Automation
Now, with the obtained "User" data (User ID), we can query for different information through the Atlassian REST API.
- To do this, we start by entering the Webhook URL specified in the Atlassian REST API documentation into the Web Request URL field. Since the API takes "accountId" as a parameter, we include this parameter and add our created variable (createdUser) in Jira.
- When sending the createdUser variable, as seen in the image below, it needs to be sent URL Encoded. Therefore, we add the ".urlEncode" function to our variable.
- In the Authorization section, we need to enter a token that has the necessary permissions to communicate with the API in Atlassian.
- Selecting the first checkbox under "Wait for response" can be beneficial for us. This feature ensures that requests can continue if there is an empty data return when communicating through the API. Without this feature selected, your API requests may not be delivered, and the automation may fail.
- To learn more about making a web request in Atlassian, you can refer to Atlassian's documentation: The Jira Cloud platform REST API
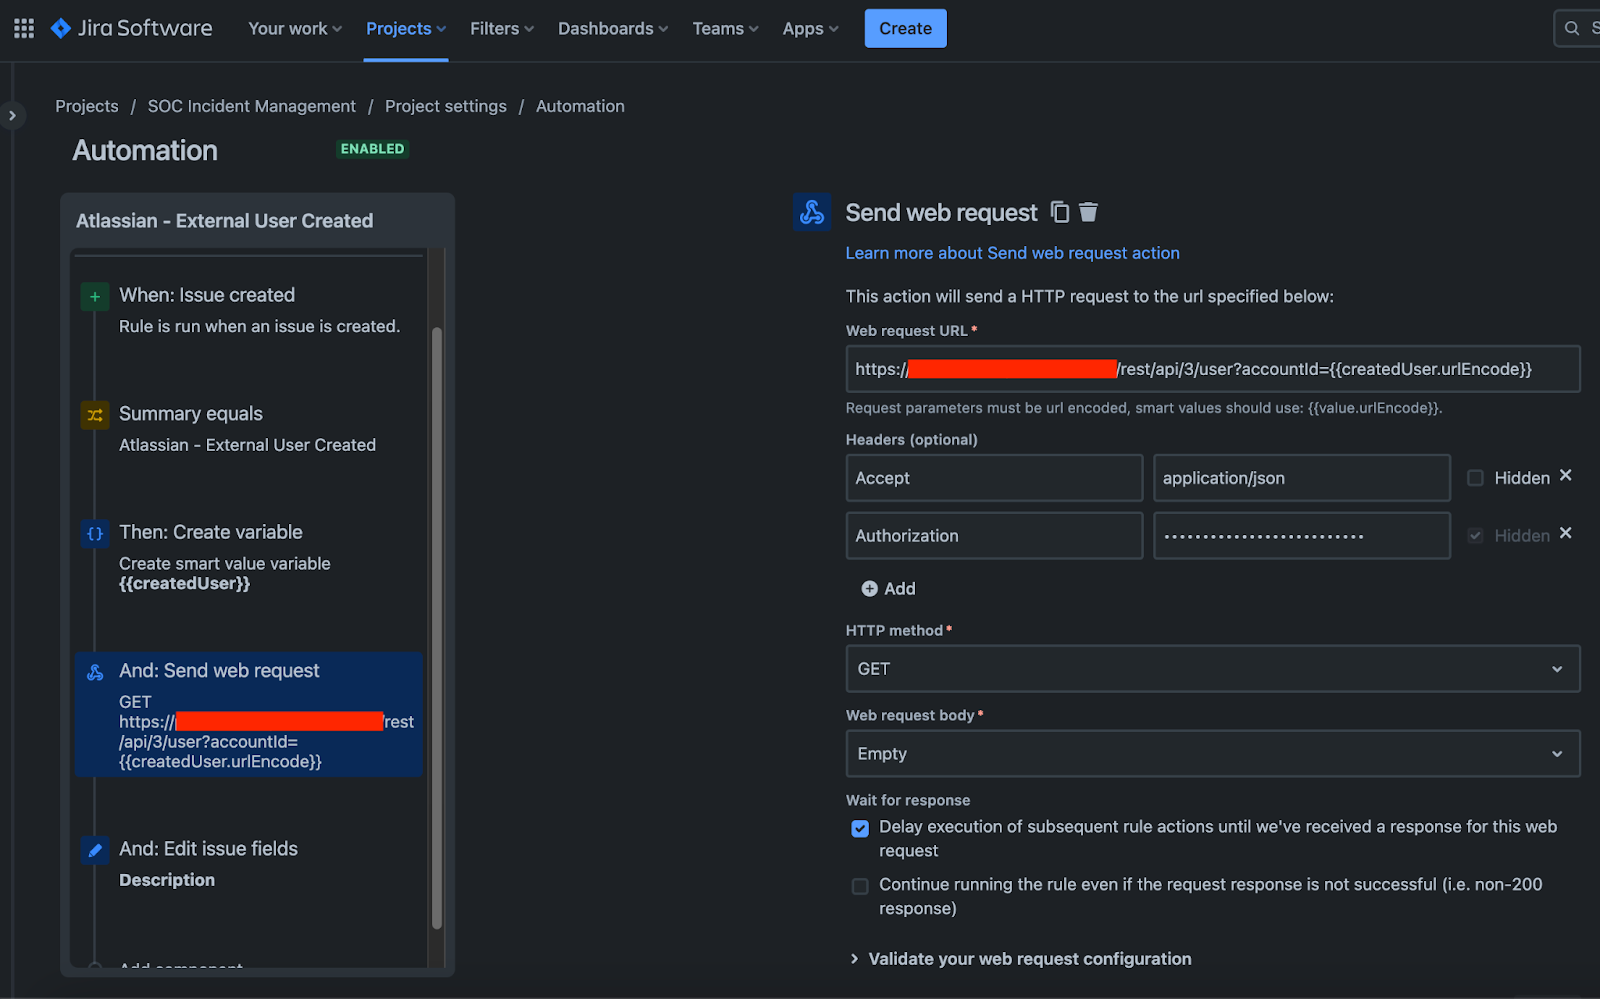
Figure 20: Communication With API
Finally, we are ready to add the data we obtained through API communication to our alarms.
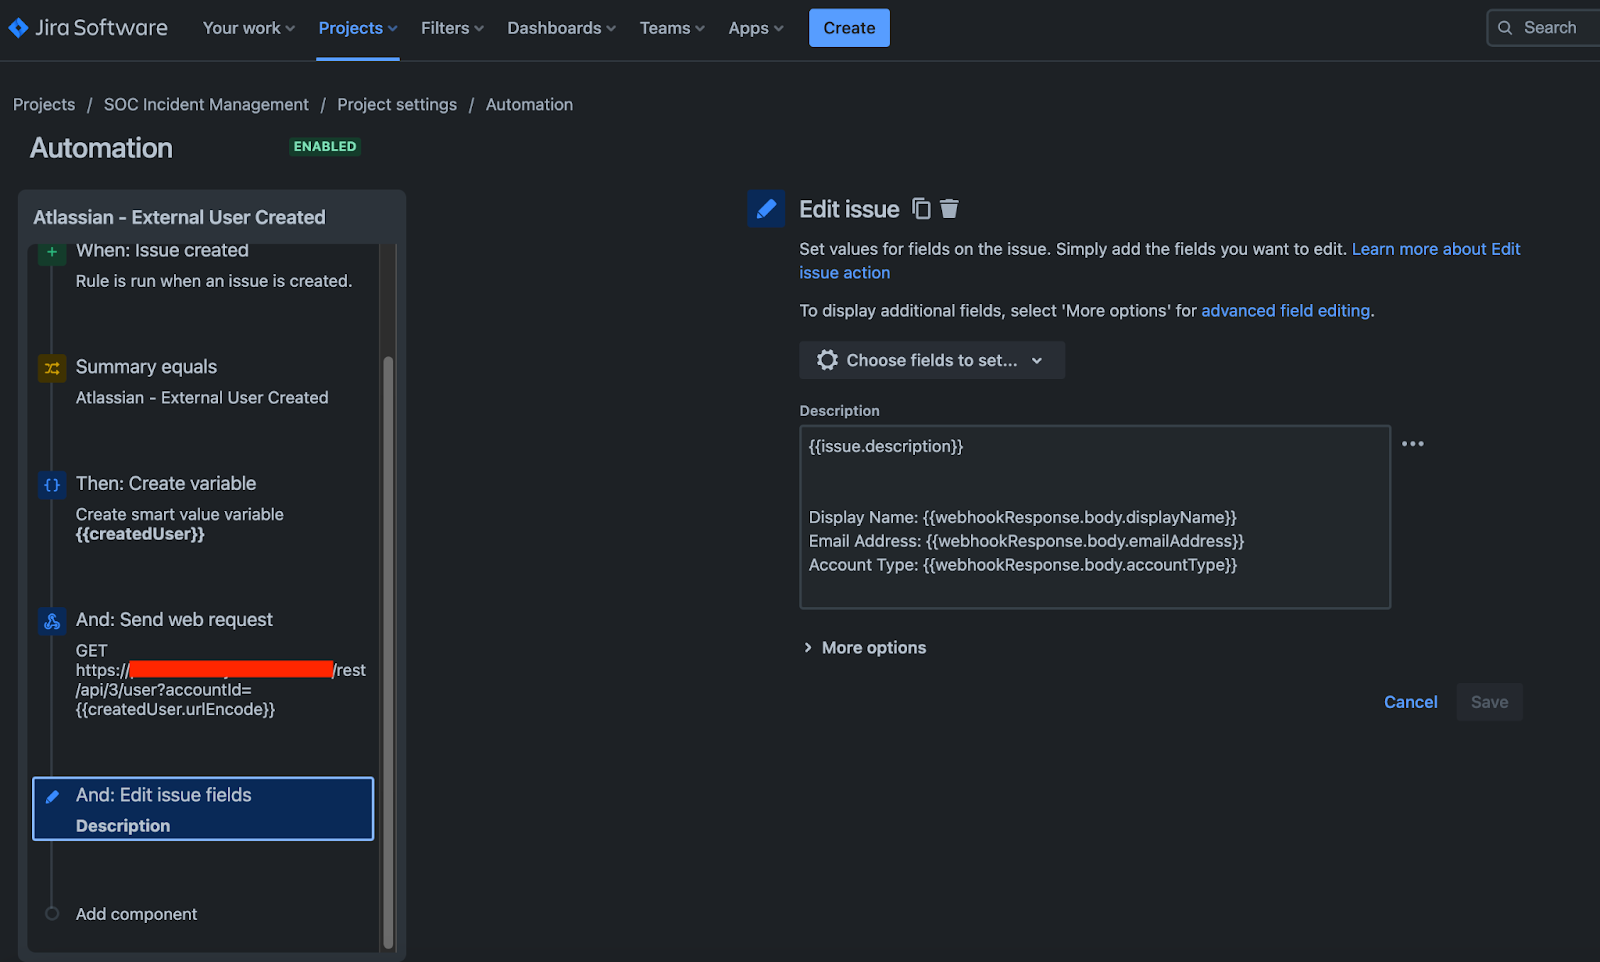
Figure 21: Edit the Alert Output
- In our automation, we add an "Edit" action.
- We select the field we want to edit. Here, we want to edit the Description section. While editing the Description of our alarm, we will use the structures found in Jira's syntax.
- As seen in the image, we can print the content of our existing alarm using the issue.description variable.
- To print the Display Name, Email Address, and Account Type data, we use the webhookResponse.body structure and add the variables found in the body to the description in the automation.
If you wish, you can also examine these values and the API structure using Postman.
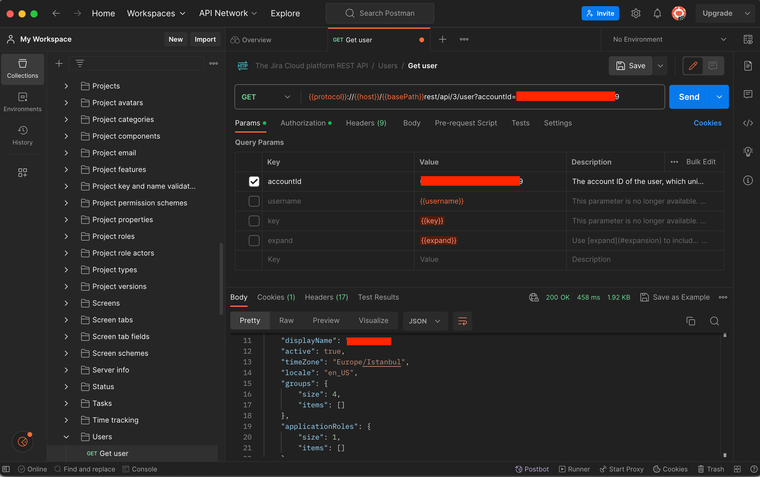
Figure 22: API Usage on Postman
We have completed our automation! Now, whenever an external user is added to any Atlassian environment:
- First, a scan will be executed in Splunk, and then the alarm will be sent to Jira.
- Before the alarm is printed to the Jira Board, our automation will communicate with the Atlassian REST API to determine to whom the user ID from the logs belongs.
- Once it has obtained this information, it will add it to the alarm and then place it on our Jira Board.
The before and after states of the alarm, in terms of automation processes, will look as follows:
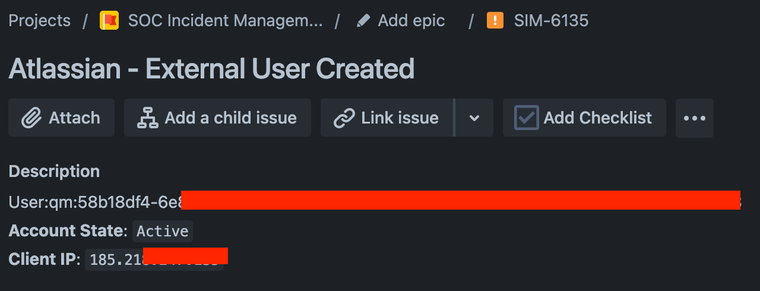
Figure 23: Before automation processes
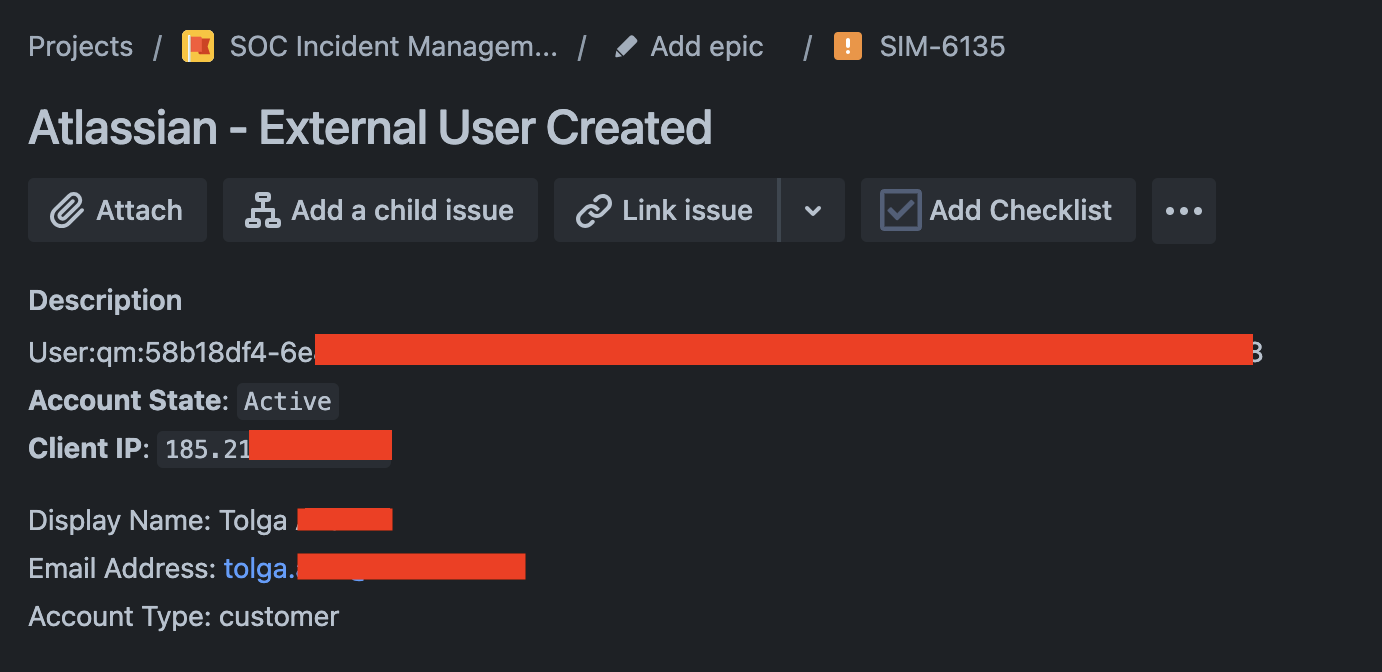
Figure 24: After automation processes
For more information about Jira automation syntax, you can refer to the following resources: Jira Cloud automation | Cloud automation Cloud | Atlassi an Support
Conclusion
Atlassian platforms offer strong tools for organizing work and collaborating, but when using these tools, safety and data integrity are crucial. Transferring Atlassian logs to a tool like Splunk, setting up alerts, and handling them in a user-friendly system can boost security and performance. This is a vital step in spotting possible security breaches, reacting quickly, and enhancing business processes. Yet, sometimes, like in our situation, there might be log shortages that reduce what we can see and how fast we can respond, and enriching logs may not always be doable. In such situations, an alternative option is to enrich the content of our alarms through automation. This allows us to:
- Expedite the process of reviewing alarms as security teams.
- Obtain information about a case more easily.
- Enhance the readability of our alarms.
- Simplify the management of our alarms.
It's important to remember that this work is in the initial stages. Refining detection rules is a continuous process that requires security teams to develop detection content with threat-centric focus.
![]()
![]()
![]()


.png?width=353&height=200&name=Ni8mare-ET-preview-oct25%20(1).png)