Updated September 2026 · Source: Picus Blue Report 2026, 338M+ attack simulations, January–June 2026
- Energy and Utilities blocked 69% of simulated attacks in 2026, down from 73%, now level with the all-industry average.
- Matching the average is not a safety signal; attackers do not grade on a curve.
- The sector doubled its log score from 27% to 55% but alerts on only 16% of attacks.
- Once an attacker is inside, only 37% of actions are blocked; discovery is stopped 1 in 10 times.
- The least prevented technique is Impair Command History Logging (T1562.003) at 1%.
Data note: every figure here was measured, not surveyed. Picus customers ran the simulations against their own production security stacks; Picus Labs anonymized and aggregated the results. The patterns described alongside the numbers are what we see repeatedly in those environments.
How did Energy and Utilities perform in cybersecurity in 2026?
Energy and Utilities scored 69% prevention effectiveness in the Picus Blue Report 2026, down four points from 73% in 2025 and equal to the all-industry average.
Prevention effectiveness is a Breach and Attack Simulation (BAS) metric: known threats are run against the organization's own security stack, each broken into individual attack actions, and the score is the share of those actions the controls blocked.
|
Metric (Energy & Utilities) |
2025 |
2026 |
Global 2026 |
|
Prevention effectiveness |
73% |
69% |
69% |
|
Log score |
27% |
55% |
58% |
|
Alert score |
13% |
16% |
14% |
The level is average; the direction is not.
The global average rose seven points to 69%; Energy and Utilities fell four to the same number. Nor is 69% mature in itself: one attack action in three is not blocked, and an AI-assisted adversary who is stopped once can rerun the chain ten times for a few tokens.
Does matching the industry average mean Energy and Utilities are secure?
No. A benchmark describes the sector, not your organization.
- Transportation rose 29 points to 79% this year;
- Education fell 30 points to 40%.
A number that moves 30 points in a year is not measuring anyone's security; it is measuring who kept testing and who eased off. Strong performance is rented, not owned.
Consider what "we match our peers" buys after an incident: "We were breached by ransomware, but so was everyone in our sector." That saves neither a job nor a substation. The old logic was that you only had to outrun your neighbor, not the lion; today there are many lions.
The only number that describes your organization is your own trend line against defined attacker behaviors, measured against your own controls.
Why did Energy and Utilities prevention drop in 2026?
Prevention dropped because controls were not re-tested as fast as the environment changed. The Blue Report 2026 calls this drift: new techniques, infrastructure changes and configuration decay eroding controls that were strong months earlier.
Drift is rarely dramatic. The pattern we find most often in EDR and XDR configurations is an exclusion added to quiet a false-positive burst, often on the temp folder, exactly where attackers drop their tooling. One sysadmin added it during a busy week; two years later that person has left, there is no ticket, and nobody knows the exclusion exists. A control switched to monitor-only during a migration and never switched back is the same story. Neither raises an error; a control that has stopped blocking looks identical on a dashboard to one that blocks everything. That is why the same class of product scores near 100% in one environment and near the floor in another, and why organizations at the bottom do not know they are there.
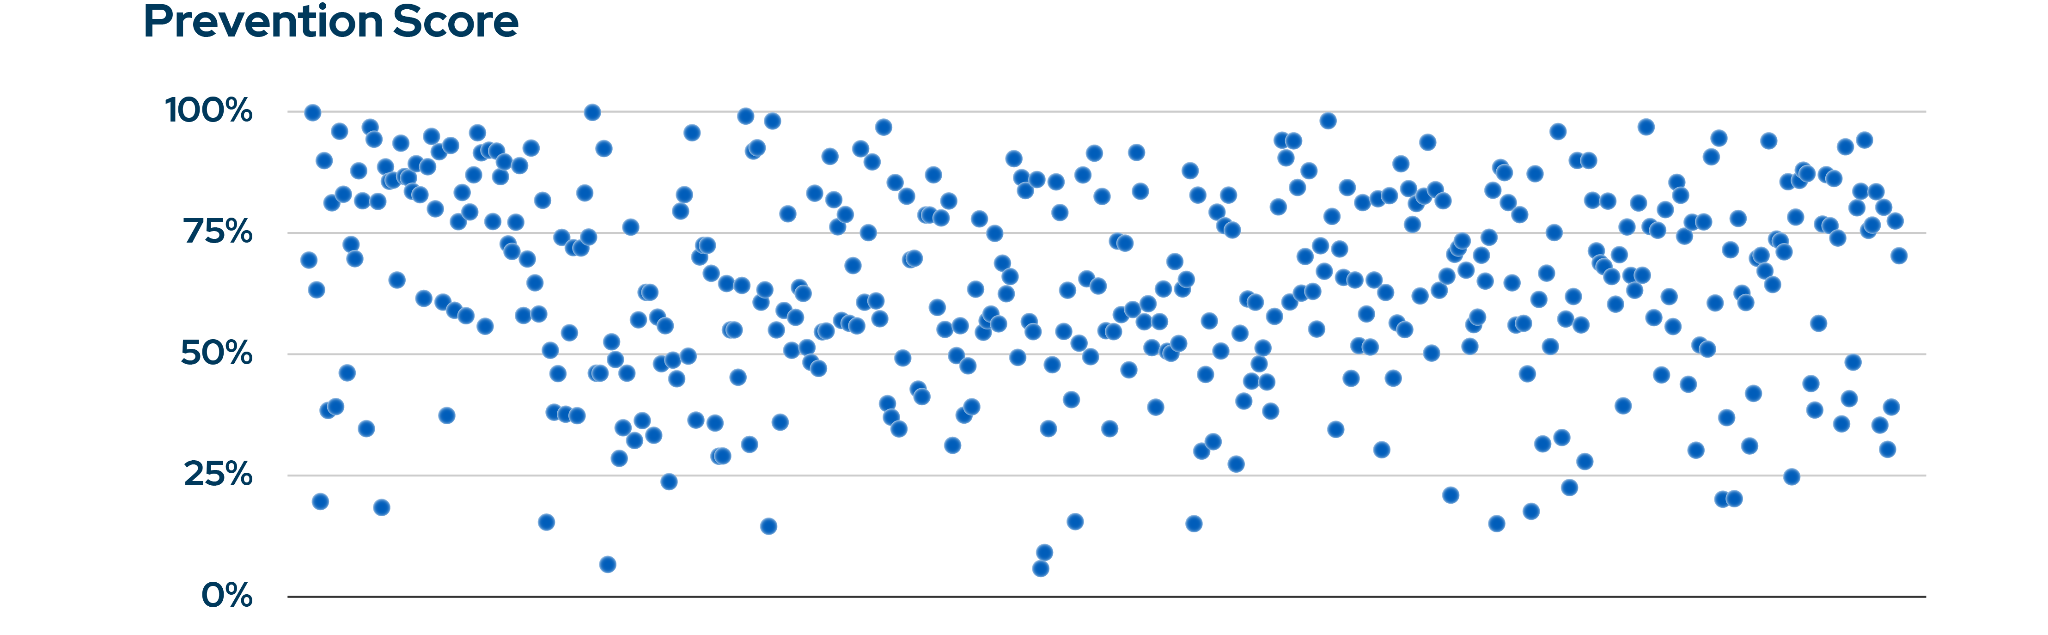
Fig 1. Prevention scores by customer environment, Picus Blue Report 2026. Same control class, results from near 100% to below 25%.
The counter-example is in the same dataset: Government and Non-Profits rose from 72% to 80%, consistent with sustained validation.
What are the biggest security gaps for utilities in 2026?
Gap 1: The interior is soft (37% post-compromise prevention)
The 37% figure comes from Autonomous Penetration Testing, not from BAS. In this test, customers run full attack chains from an authenticated, domain-joined machine, the position an attacker holds after one successful phishing email or one stolen credential, and the score is how often their controls stop what the attacker does next. Across all post-compromise actions, only 37% were blocked.
Loud actions are caught, quiet ones are not: lateral movement (90%) and privilege escalation (85%) are stopped nine times in ten; ransomware encryption is blocked 28% of the time, credential access 22%, and discovery just 10%.
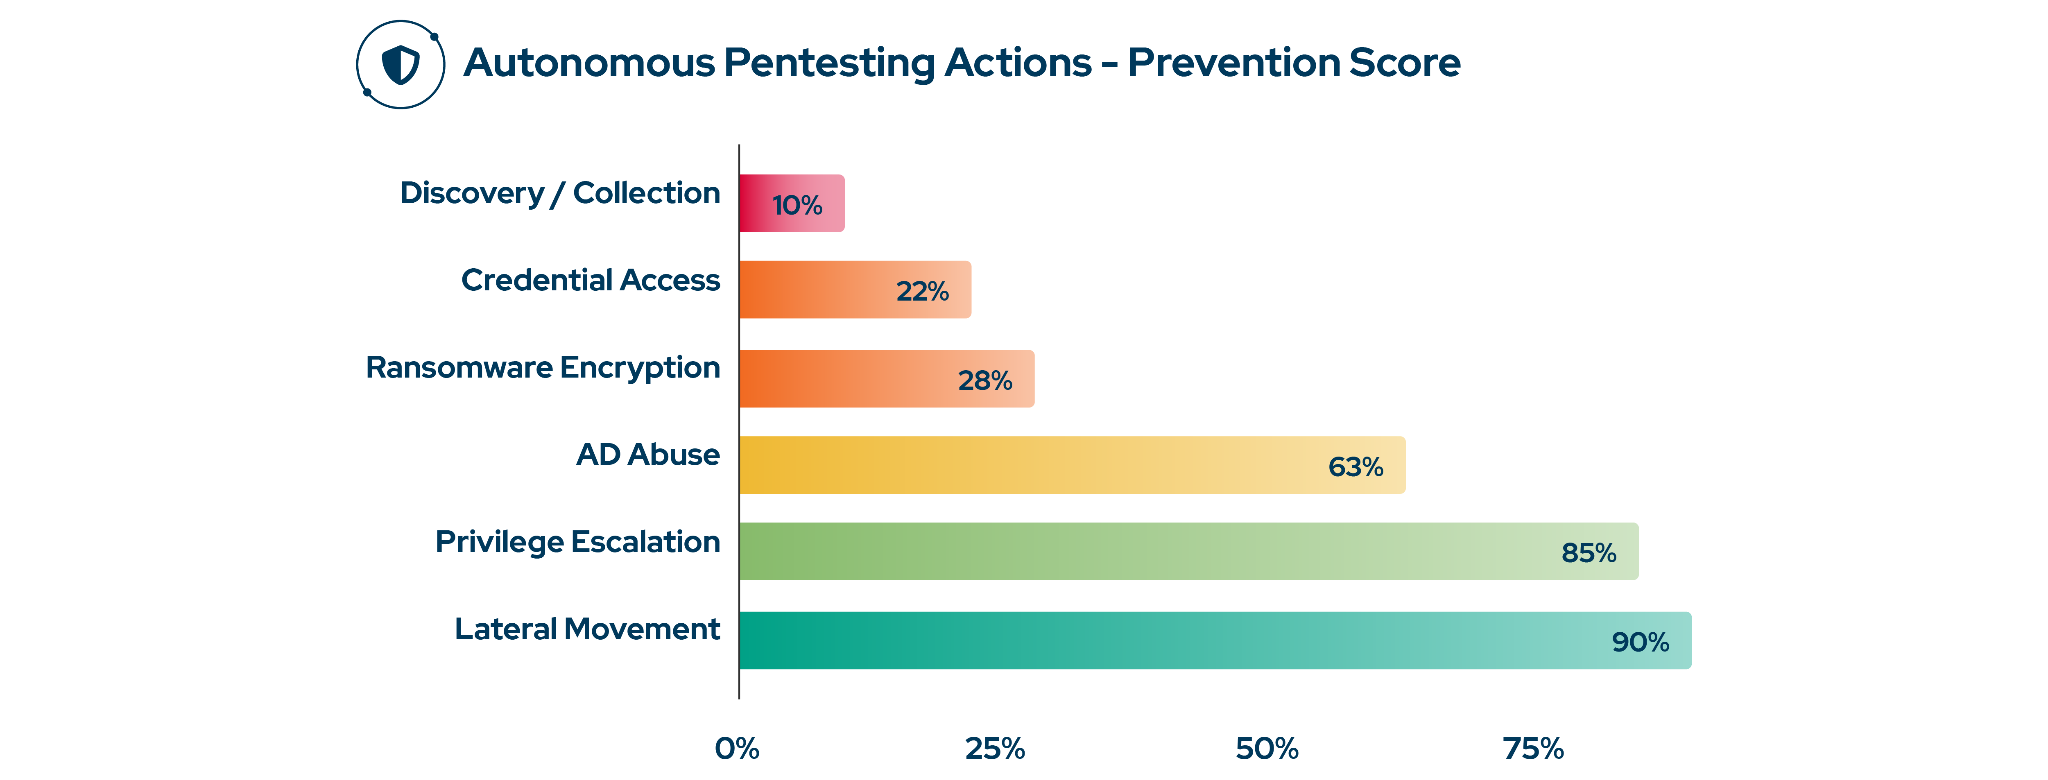
Fig 2. Post-compromise prevention by attack action, Autonomous Penetration Testing 2026. Lateral movement 90%, discovery 10%.
Attackers no longer hack in; they log in. With one valid account they enumerate shares, sessions and the domain, then come back tomorrow or in a month with a complete map. In a utility, that interior holds engineering workstations, historians and the jump servers into operational networks; one long-lived vendor credential is enough to map it below the threshold of the controls that produced the 69%.
Discovery is hard to block because, command by command, it is administration; only the sequence separates intruder from engineer. Where that is too noisy to alert on, make the interior loud by construction: tiered administration, IT/OT segmentation, and decoy accounts.
Gap 2: Recognition-based defense keeps sliding (50% malware download prevention)
Malware download prevention is 50%, down from 60% last year and 71% in 2024. The test asks one question: does the control recognize a known malicious file? Signatures are precise and cheap, but they cannot keep pace with close to two million new files a day at VirusTotal, and they say nothing about what happens once a file executes. Polymorphic or metamorphic, the behavior underneath is unchanged. Behavior is the last line of defense.
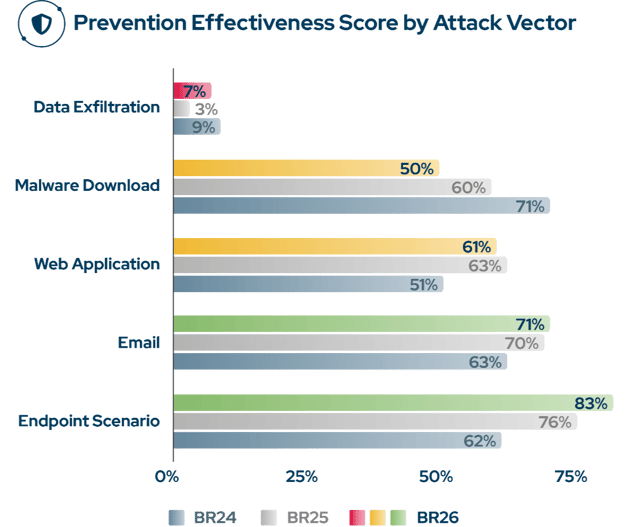
Fig 3. Prevention effectiveness by attack vector, Blue Report 2024–2026. Malware download fell from 71% to 50%.
Why doesn't more logging mean better detection?
Because logging and alerting are different work, and Energy and Utilities invested in only one. Globally, organizations log 58% of attacks and alert on 14%. Energy and Utilities logs 55% and alerts on 16%. The sector added 28 points of visibility; its alert score moved three. Forwarding everything into the SIEM mostly buys storage.
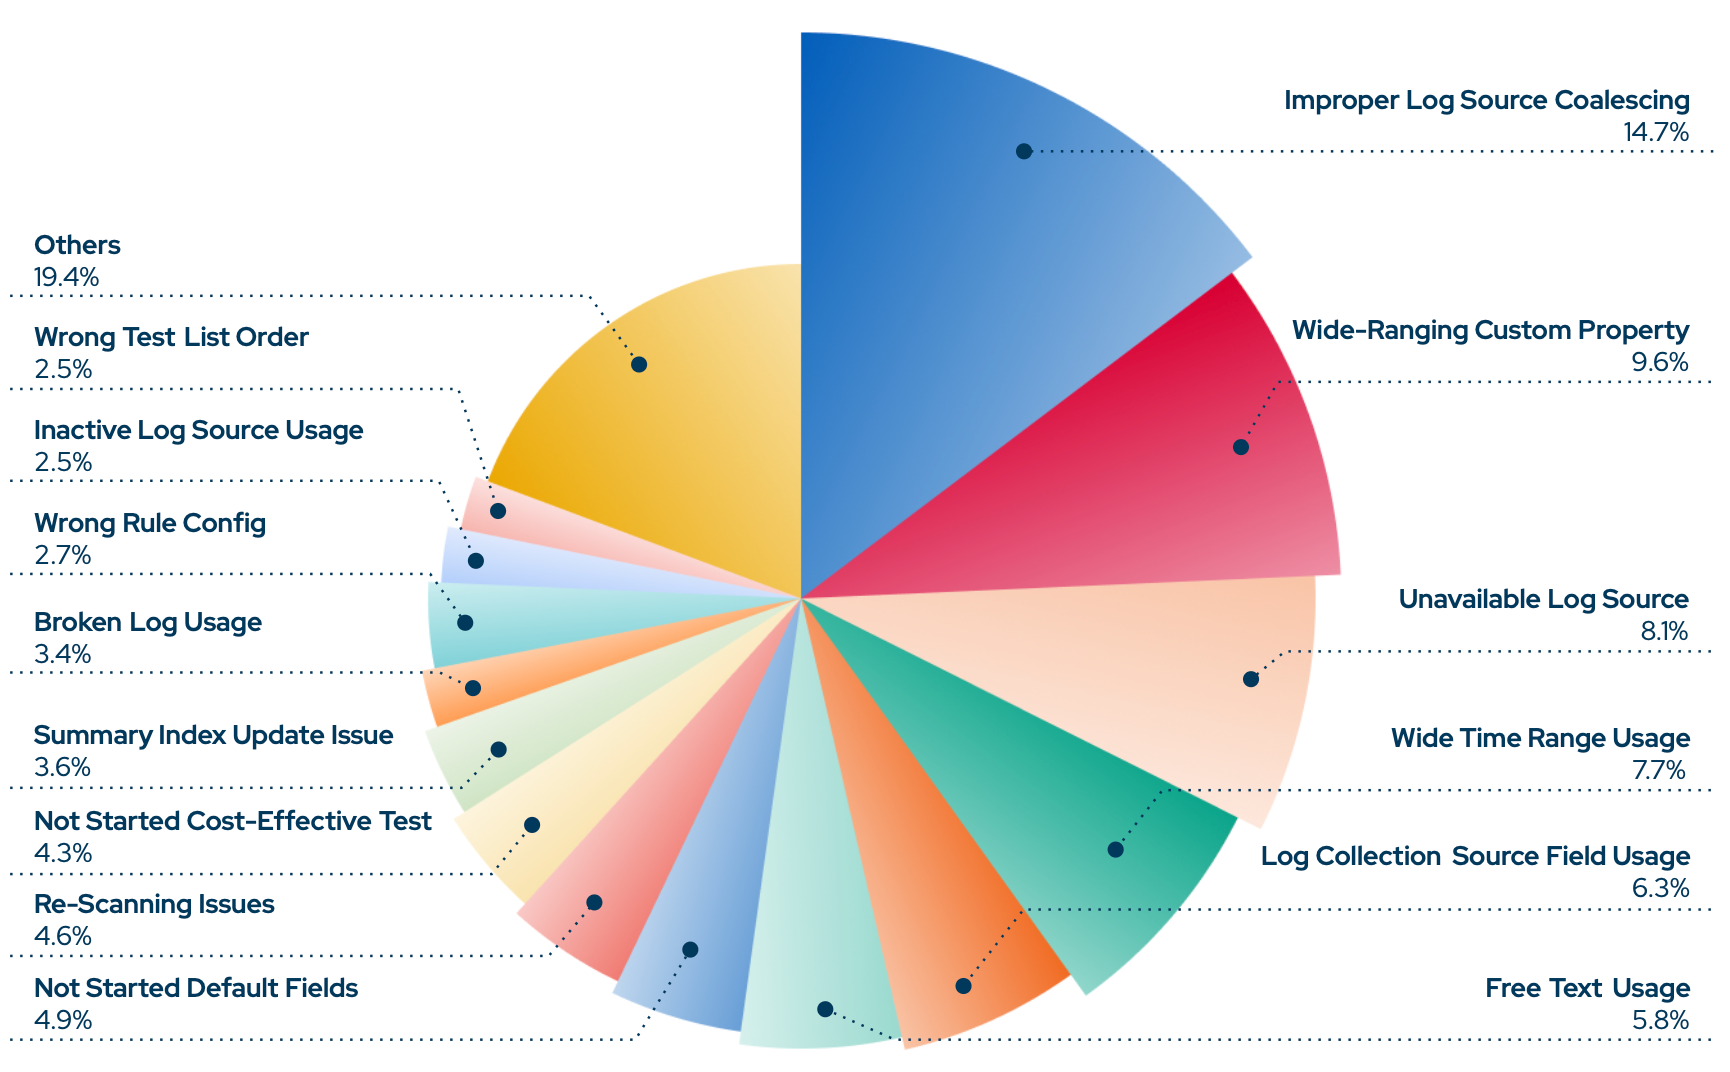
Fig 4. Causes of detection rule failures, Blue Report 2026. Improper log source coalescing leads at 14.7%.
Detection rule failures now split into performance issues (49%), log collection issues (41.5%) and configuration issues (9.5%). Overly broad rules (Wide-Ranging Custom Property Definition 10%, Wide Time Range Usage 8%) slow queries and feed alert fatigue; Improper Log Source Coalescing remains the single most common issue at 15%.
Rules also stay unwritten for a human reason. Much of what matters sits in a gray area: a PowerShell script enumerating hosts could be an intruder or a sysadmin automating a task, and teams resolve the ambiguity by not alerting. Latin America raised its alert score from 8% to 25% by writing rules against telemetry it already had. And it matters more every quarter: an agentic SOC works from alerts, and with none it is blind.
Is the logging itself protected?
Monitoring what logs contain is not the same as monitoring whether logging is intact. Impair Command History Logging (T1562.003) was blocked in 1% of simulations, Downgrade Attack (T1562.010) in 16%. No legitimate user performs these; a deleted log is a red flag whether the actor is an intruder or an insider covering tracks. Chained with a quiet step it becomes persistence: add an account, delete the log of its creation, and the backdoor survives a restore from backup. Ship logs off the host in real time, the same principle utilities apply to backups.
NERC CIP-008 requires reporting a Reportable Cyber Security Incident to the E-ISAC and CISA within one hour of determination; an intrusion that never produces an alert is never determined, and the clock never starts. Afterward, without intact logs, no utility can honestly state that no customer data was accessed.
How is the 2026 threat landscape changing for critical infrastructure?
The Blue Report 2026 frames the year in one line: in the post-Mythos era, adversaries weaponize new vulnerabilities in roughly eight hours. Three external developments support it:
- Anthropic's April 2026 preview of Claude Mythos;
- the August 2026 NSA/CISA/FBI warning that attackers use AI to write exploit scripts against industrial control systems, including Siemens S7 PLCs; and
- the 27 August open letter from OpenAI, Anthropic, Google and more than a hundred companies naming water treatment plants.
Researchers have also shown AI porting a vulnerability from one PLC model to another. For a utility, the working assumption becomes: there is always a patching gap.
The ten least prevented vulnerabilities of the year, all disclosed in 2025 or 2026 and all blocked less than 25% of the time, cluster by weakness class, not by vendor: memory safety, input handling, local privilege escalation.
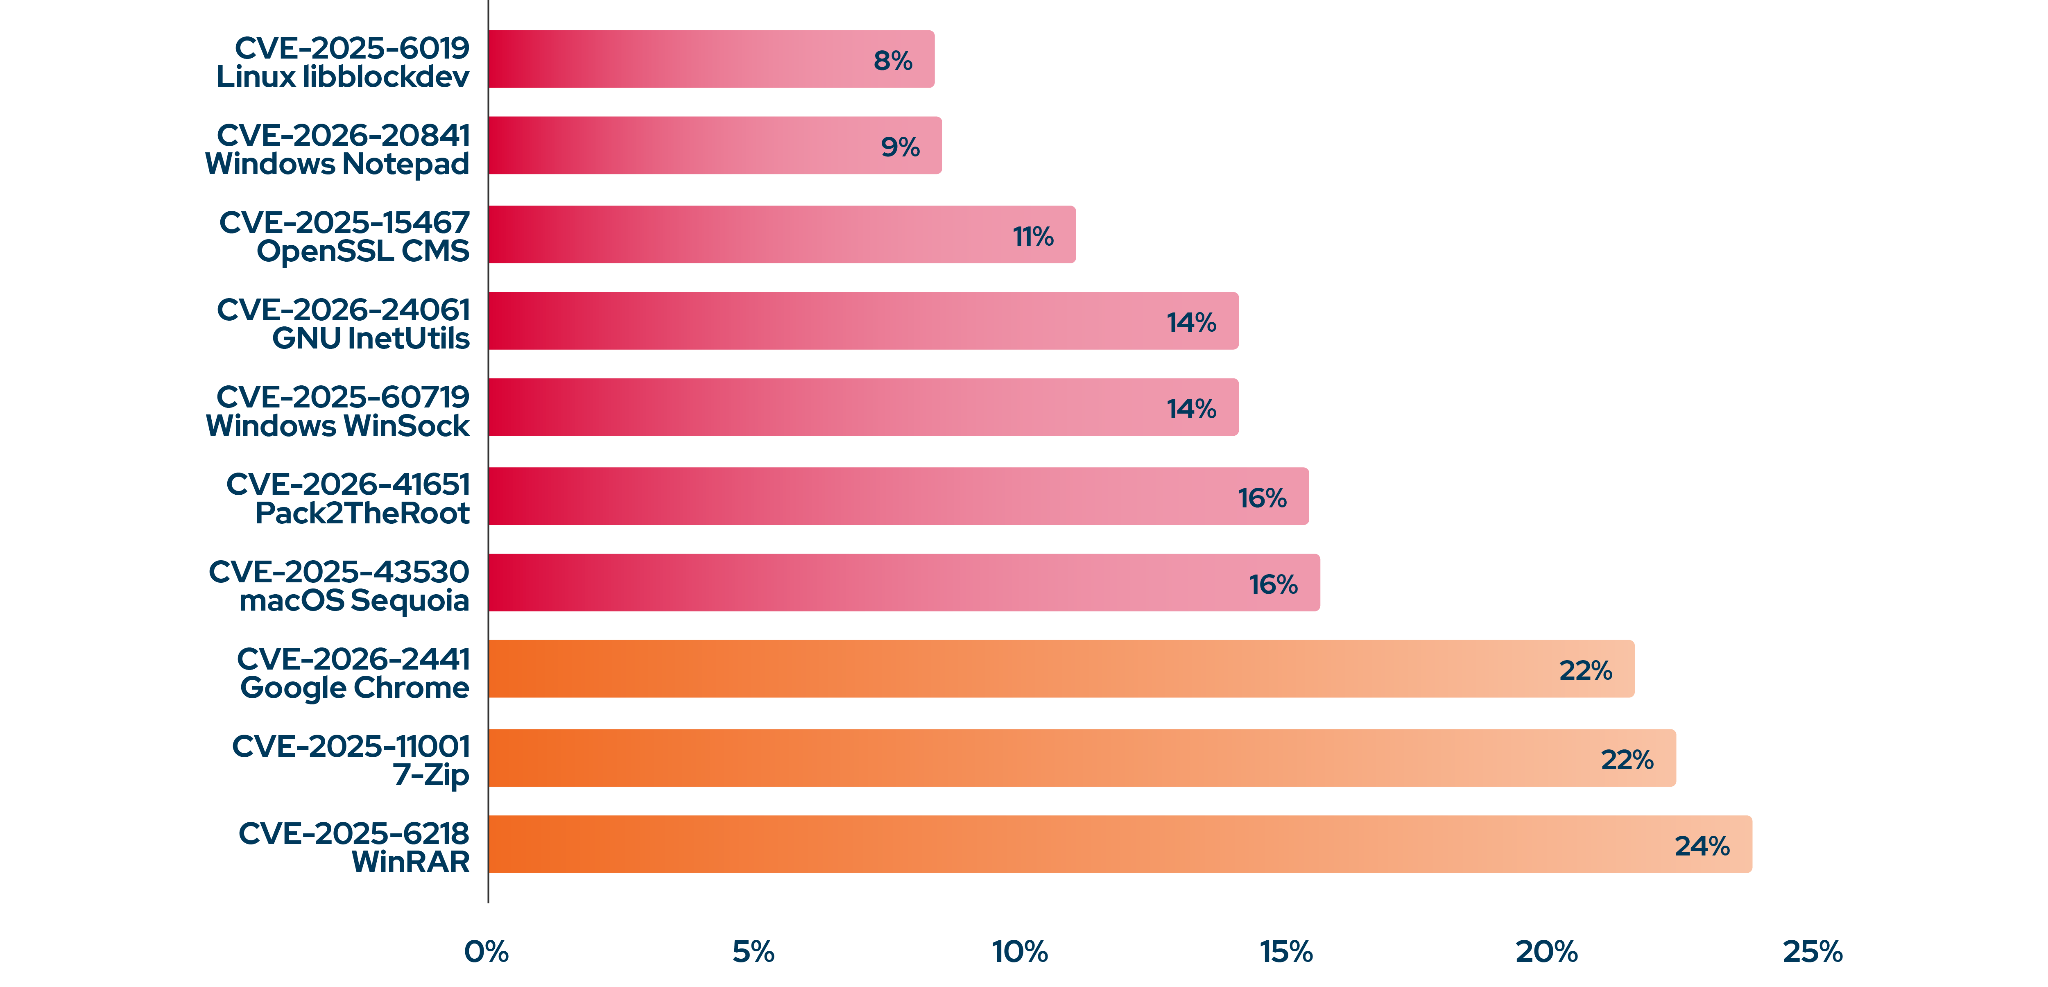
Fig 5. Ten least prevented vulnerabilities of 2026, all blocked under 25%. Linux libblockdev (CVE-2025-6019) lowest at 8%.
The question that matters is not how a CVE scores but whether the technique behind it completes against your controls, and in a utility that is hardest to answer where it matters most. Engineering workstations, historians and operational systems carry the highest consequences and the strictest change windows, so they are the assets least likely to be tested. A nuclear plant and a web server should not share a patch threshold, but a refused patch window should end in a signed risk exception, not silence; in our experience the real conversation starts when someone is asked to sign. Exposure Validation gives that conversation evidence without firing a live exploit: it tests the technique chain a CVE depends on against the controls on the asset, so restricted and air-gapped systems get the same proof as everything else.
Which cyber threats should Energy and Utilities validate against?
In a utility, the report's least prevented techniques line up into one attack sequence, and the loud steps come last.
|
Stage |
Technique |
Prevented |
Why it matters in a utility |
|
Entry |
Valid Accounts (T1078) |
15% |
Long-lived engineering and vendor-access accounts look legitimate |
|
Mapping |
Discovery / Collection (post-compromise) |
10% |
The map is how an attacker finds the path from IT toward operations |
|
Control |
Application Layer Protocol (T1071) |
16% |
C2 over HTTPS, DNS, SMTP looks like normal operations |
|
Control |
Data Encoding (T1132) |
9% |
Encoded outbound channels stay open |
|
Cover |
Impair Command History Logging (T1562.003) |
1% |
Least prevented technique in the report; deletes telemetry at the source |
|
Cover |
Downgrade Attack (T1562.010) |
16% |
Forces weaker protocol or logging modes |
|
Impact |
Account Access Removal (T1531) |
2% |
Locks operators out of their systems during extortion |
|
Impact |
Service Stop (T1489) |
19% |
An operational event with customers on the other end |
Ransomware sits on top of that sequence and is regressing. All ten least prevented families scored 38% or lower; the bottom-ten average fell from roughly 44% to 32%; not one improved. Play collapsed from 50% to 13%.
Why does the same attack score 94% and 3%?
One comparison from the Autonomous Penetration Testing data exposes the mechanism. The same tool, Mimikatz, was run three ways: dumping credentials from LSASS memory, the heavily signatured path, was blocked 94% of the time; reading RDP credentials from memory, 17%; reading LSA secrets from the registry, 3%.
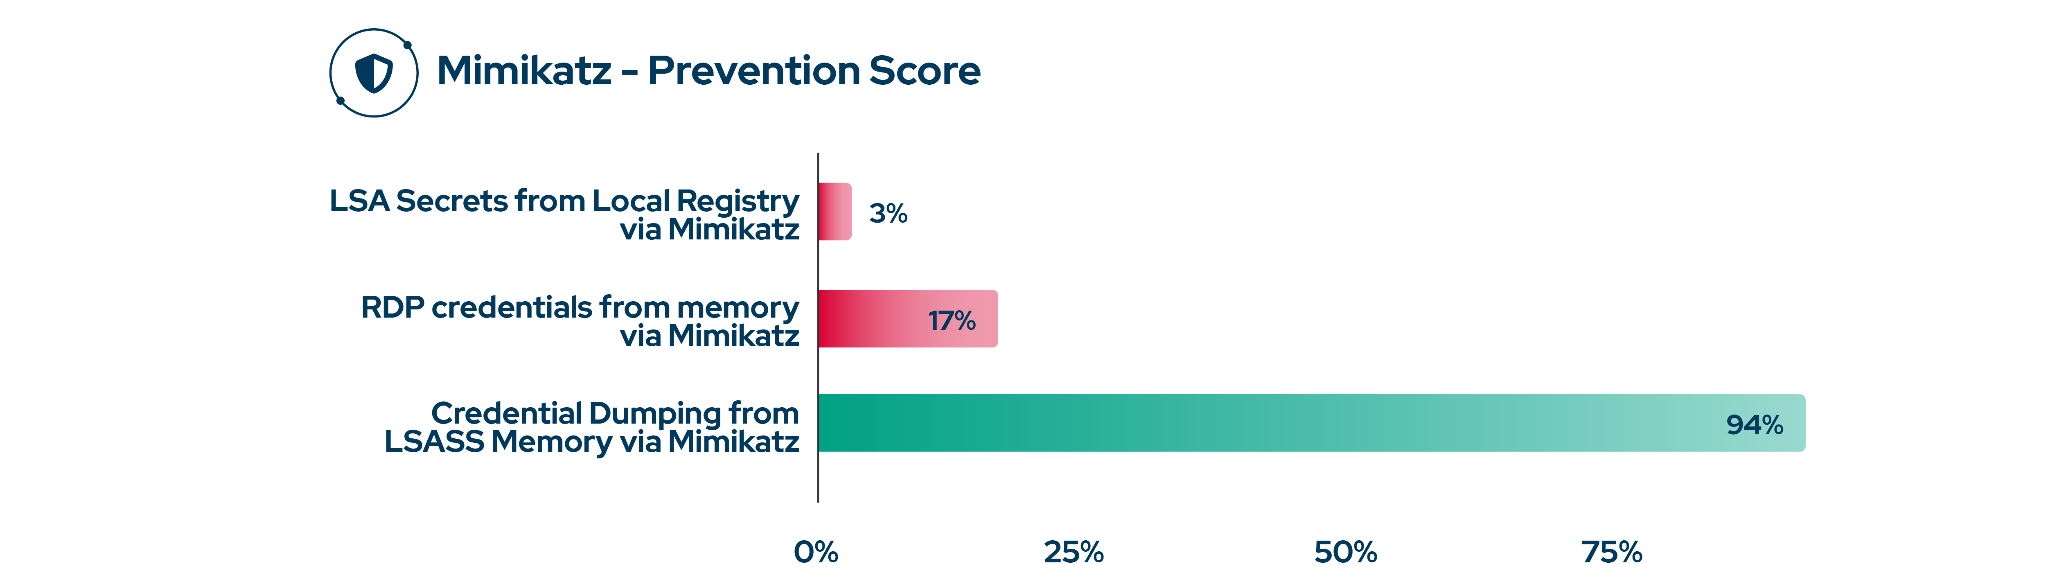
Fig 6. Mimikatz credential theft prevention by method, 2026. LSASS dump 94%, RDP memory 17%, registry LSA secrets 3%.
Only the recognizability of the method changed. Some controls still key on indicators as shallow as a function name: change the string, recompile, and the detection is gone. Attackers test in private sandboxes until nothing fires, then use the result for at least 24 hours, and 24 hours inside a utility is a long time.
How can Energy and Utilities improve cybersecurity in 2026?
- Stop reading the benchmark as a verdict. Measure which attack chains your controls block today, and whether that held last quarter.
- Re-validate controls before drift compounds; Exposure Validation extends the same evidence to restricted and air-gapped assets without firing an exploit.
- Convert the new telemetry into detection. Write rules against the doubled log coverage, test that they fire, and alert on tampering itself: a log source going quiet should fire first.
- Test the interior between IT and operations. Autonomous Penetration Testing shows what one compromised account reaches before a real attacker does.
- Simulate full kill chains, including the quiet steps. With Play at 13%, coverage validated against last year's variants fails against this year's.
- Keep the basics that make the rest work: MFA, backups that are tested and restore, patching when a patch exists. Without these, attackers do not need AI.
Bottom line
Energy and Utilities doubled its log coverage, let alerting settle at 16%, and drifted to 69% prevention. The benchmark shows where the sector stands, not where any utility stands.
The only number that does is the one validation produces:
- what your controls block at the edge, measured by Breach and Attack Simulation;
- what an attacker reaches once inside, measured by Autonomous Penetration Testing; and
- which exposures matter on the assets you cannot test live, measured by Exposure Validation.
The utilities that move first will be the ones whose one-hour clock starts because something actually fired.
Download the Blue Report 2026 for the full industry analysis.


.png?width=353&height=200&name=picus-threat-research-preview-Dragon%20Breath-august-11%20(1).png)