.svg)


.svg)


Parent Process ID (PPID) spoofing is a common tactic for defense evasion and privilege escalation. Default Windows security logs catch some activity, but reliable detection of PPID spoofing needs additional telemetry that is not enabled by default. In this article, we will cover:
- Process ID and its types
- Event Tracing For Windows (ETW)
- Parent Process ID spoofing attacks and example
- Detection of Parent Process ID spoofing attacks using Kernel-Process Logs
1. What is Process ID?
Process ID (PID) is a unique number that identifies any process currently running on the operating system. In Windows, Process ID can be viewed using various tools and commands such as tasklist and wmic commands or Process Explorer in Sysinternals. In Linux and Unix, the ps command lists PIDs. PID can be used to call or kill a process.
When a process spawns another process, it becomes a parent process, and the spawned process becomes a child process. Process IDs of these processes are recorded in event logs. For example, Kernel-Process logs of Process A keep three types of PID records:
- Process ID: PID of Process A
- Parent Process ID: PID of the parent process of Process A
- Execution Process ID: PID of the process that executes Process A
1.1 Viewing Process ID in Windows
Let’s show how to view Process ID in Windows using tasklist and wmic command-line tools. Also, Process Explorer shown in Figure 1 is an easy-to-use alternative to view Process ID.
|
> tasklist /fi "IMAGENAME eq explorer.exe"
|
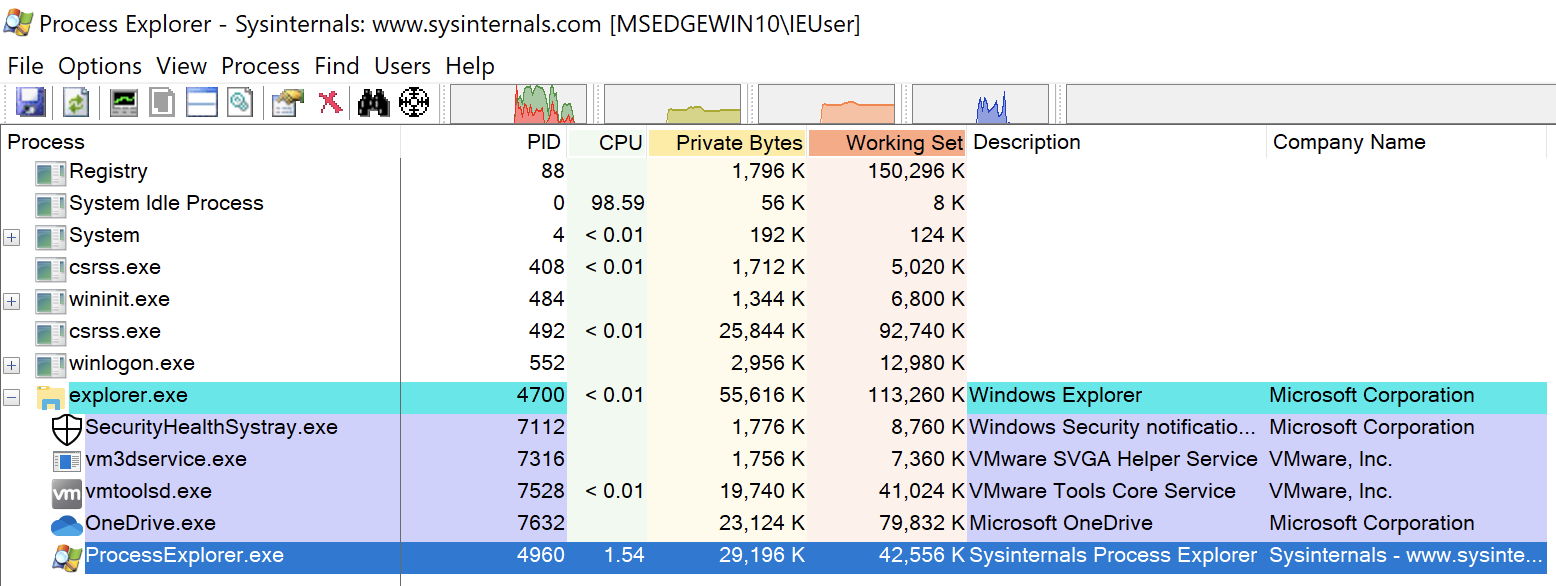
Figure 1: Process Explorer
2. Event Tracing for Windows
Event Tracing for Windows (ETW) is a kernel-level monitoring tool to monitor kernel or application-level logs in real-time [1]. These logs can be used to debug an application or detect performance issues.

Figure 2: Event Tracing Model
ETW consists of 3 components;
- Controllers: The modules that
- define size and location of the log file
- start and stop event tracing sessions
- enable providers to log events to the session
- Providers: The modules that produce event logs
- generate events
- produce event logs when enabled by a controller
- Consumers: The modules that use the generated event logs
2.1. How to Start an Event Tracing Session?
ETW structure allows dynamic management of event tracing sessions. Event tracing sessions can be started and managed by built-in controllers such as the logman command and perfmon tool.
2.1.1. Starting Event Trace Session with logman
logman is a built-in Windows command-line tool included in the controller group of ETW components. logman can start and control event trace sessions. Let’s see some examples of usage of logman.
- List available providers on Windows
|
> logman query providers Provider GUID ------------------------------------------------------------------------------- .NET Common Language Runtime {E13C0D23-CCBC-4E12-931B-D9CC2EEE27E4} ACPI Driver Trace Provider {DAB01D4D-2D48-477D-B1C3-DAAD0CE6F06B} Active Directory Domain Services: SAM {8E598056-8993-11D2-819E-0000F875A064} Active Directory: Kerberos Client {BBA3ADD2-C229-4CDB-AE2B-57EB6966B0C4} Active Directory: NetLogon {F33959B4-DBEC-11D2-895B-00C04F79AB69} ADODB.1 {04C8A86F-3369-12F8-4769-24E484A9E725} ADOMD.1 {7EA56435-3F2F-3F63-A829-F0B35B5CAD41} Application Popup {47BFA2B7-BD54-4FAC-B70B-29021084CA8F} Application-Addon-Event-Provider {A83FA99F-C356-4DED-9FD6-5A5EB8546D68} ATA Port Driver Tracing Provider {D08BD885-501E-489A-BAC6-B7D24BFE6BBF} AuthFw NetShell Plugin {935F4AE6-845D-41C6-97FA-380DAD429B72} . . . |
- List the providers that are currently tracing and working in Windows
|
> logman query -ets |
- Look into details of any provider with their GUID
|
> logman query providers {22FB2CD6-0E7B-422B-A0C7-2FAD1FD0E716} |
Providers may produce multiple log types categorized with different keywords. When setting up a data collector, log types to be collected are selected using these keywords.
The example log shown below can be retrieved when the WINEVENT_KEYWORD_WORK_ON_BEHALF keyword from Microsoft-Windows-Kernel-Process is assigned to an event trace sessio
|
-<Event xmlns="http://schemas.microsoft.com/win/2004/08/events/event"> |
- Start a new event trace session
|
> logman create trace "Sample-trace" -ets |
- Assign the provider and select logs to be collected for the new event trace session
|
> logman update Sample-trace -p Microsoft-Windows-Kernel-Process 0x70 -ets The command completed successfully. > logman query Sample-trace -ets Name: Sample-trace Status: Running Root Path: C:\ Segment: Off Schedules: On Name: Sample-trace\Sample-trace Type: Trace Output Location: C:\Sample-trace.etl Append: Off Circular: Off Overwrite: Off Buffer Size: 8 Buffers Lost: 0 Buffers Written: 2 Buffer Flush Timer: 0 Clock Type: Performance File Mode: File Provider: Name: Microsoft-Windows-Kernel-Process Provider Guid: {22FB2CD6-0E7B-422B-A0C7-2FAD1FD0E716} Level: 255 KeywordsAll: 0x0 KeywordsAny: 0x70 (WINEVENT_KEYWORD_PROCESS,WINEVENT_KEYWORD_THREAD,WINEVENT_KEYWORD_IMAGE) Properties: 64 Filter Type: 0 The command completed successfully. |
Event Trace Session logs are recorded in the Output Location in .etl format. The logs can be examined in the Event Viewer. Keywords of the collected logs are given as KeywordsAny. In the example, 0x70 parameter in KeywordsAny represents the sum of the selected keywords’ parameter given below.
|
0x0000000000000010 WINEVENT_KEYWORD_PROCESS |
2.1.2. Starting Event Trace Session with Performance Monitor
Windows Performance Monitor is a Microsoft Management Console (MMC) snap-in that provides tools for monitoring application and hardware performance in real-time and managing data collections. Event Trace Sessions can be managed by using Data Collector Sets on the Performance Monitor.
Performance Monitor can create new Event Trace Sessions or manage currently running sessions. It can also monitor other providers running Event Trace Sessions using Data Collector Sets.
Let’s start an Event Trace Session with Performance Monitor. Microsoft has a similar guide to start a session [2]. Under the Data Collector Sets and User Defined section,
- Right Click > New > Data Collector Set
- Create manually
- Create Data Logs > Event Data Trace
- Add Providers > Microsoft-Windows-Kernel-Process
- Edit Properties > Add 0x70 Manually

Figure 3: Performance Monitor
2.1.3 Viewing collected logs
Recorded Event Trace Session logs can be examined using Event Viewer. To view in more detail,
- Enable “Show Analytic and Debug Logs” under the View tab
- Open Saved Log under the Action tab
- Select saved log file In the logman example. The saved log was stored at “C:\Sample-trace.etl”.
It should be noted that logs opened in the Event Viewer are not in real-time. If the event trace session is still ongoing, a copy of the log file will be created and the copy will be opened by the Event Viewer. In Figure 4, Sample-trace.etl is opened in Event Viewer and a single log is viewed in XML format.
Figure 4: A sample log examined in Event Viewer

3. Parent Process ID Spoofing
Parent PID Spoofing is a technique that allows attackers to run processes under any parent process they want. Effectively, the child process can have the Parent Process ID selected by the attackers. This technique enables malicious processes to evade detection methods based on the parent-child relationship and inherit access tokens from the parent process to elevate privilege.
Let’s give examples about defense evasion and privilege escalation using Parent PID spoofing.
- Assume that a malicious payload is delivered using a Word document to create a PowerShell session. In this scenario, PowerShell becomes the child process of winword.exe. However, this is not normal behavior of the Word and is easily detected by defense mechanisms. To evade detection by the defense mechanisms, a payload can be created with a different parent PID of a parent process that usually spawns PowerShell.
- Using the PROC_THREAD_ATTRIBUTE_PARENT_PROCESS attribute of CreateProcess Win32 API call, a malicious process may inherit the access token of the parent process [3]. If the parent process has a SYSTEM level access token, the malicious process gets a SYSTEM level access token as well.
Parent PID Spoofing attacks are categorized as a sub technique under the T1134 Access Token Manipulation techniques in the MITRE ATT&CK framework [4]. It is a widely used technique and detection of Parent PID spoofing is essential to the secure operation of the assets.
4. Detecting Parent PID Spoofing Attacks Using Kernel-Process Logs
So far, we have talked about process ID types, event tracing sessions, log collection, and examination. Let’s see how Parent PID spoofing can be detected using Kernel-Process logs step by step in the Windows command line.
4.1 Starting an event trace session
Using logman, start an event tracing session and start recording Kernel-Process logs.
|
> logman create trace "Sample-trace" -ets
|
4.2 Starting a notepad process
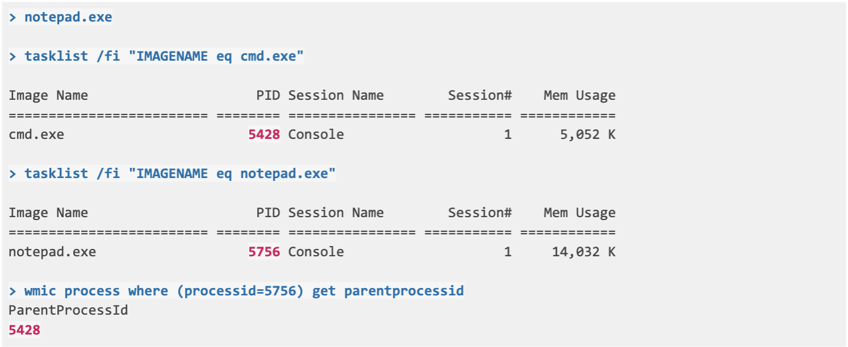
Using cmd.exe, start notepad.exe
- Child Process: notepad.exe (PID: 5756)
- Parent Process: cmd.exe (PID: 5428)
- Executing Process: cmd.exe (PID: 5428)
4.3 Starting a notepad process with Parent Process ID spoofing
Using PPID-spoof.ps1, start notepad.exe [5].
- Child Process: notepad.exe (PID: 7980)
- Parent Process: winlogon.exe (PID: 548)
- Executing Process: powershell.exe (PID: 6312)
|
> powershell PS> .\tasklist /fi "IMAGENAME eq powershell.exe" > tasklist /fi "IMAGENAME eq winlogon.exe" > tasklist /fi "IMAGENAME eq notepad.exe" |
4.4 Examining Event Trace Logs
In the Event Viewer, open the logs recorded.
- Enable “Show Analytic and Debug Logs” under View tab
- Click on Saved Log under the Actions tab
- Open the saved log file at “C:\Sample-trace.etl”.
Let’s look at the log created for starting notepad.exe without Parent Process ID spoofing. There might be lots of logs collected. So search for the term “Process 5756 started” from the Actions tab.
In this example, we see that Execution Process ID and Parent Process ID are the same. Usually, this is an expected log for starting a process.
|
-<Event xmlns="http://schemas.microsoft.com/win/2004/08/events/event"> |
Now, let’s look at the log created for starting notepad.exe with Parent Process ID spoofing. Search for the term “Process 7980 started” from the Actions tab.
In this example, we see that Execution Process ID and Parent Process ID do not match. This is very unusual for starting a process and very rarely legitimate. However, this mismatch is a key characteristic of Parent PID spoofing attacks. From this Kernel-Process log, we can detect malicious Parent Process ID spoofing attacks.
|
-<Event xmlns="http://schemas.microsoft.com/win/2004/08/events/event"> <Version>2</Version> |
5. Simulating with Picus
Picus Threat Library includes multiple Parent Process ID spoofing attack simulations. These attack simulations test detection and prevention capabilities of your security controls.
5.1 Parent Process ID Spoofing Simulation with Picus
Here's an interactive tutorial
** Best experienced in Full Screen (click the icon in the top right corner before you begin) **
5.2 Detection with Splunk
In the attack simulation with Picus, we saw that the Parent Process ID spoofing attack was not blocked by the security controls. Splunk search queries can be designed with different methods and logs types to detect Parent Process ID spoofing.
As an example, let’s see how we can detect the attack with Splunk using Kernel-Process logs. Since it is possible to detect the attack by comparing Execution PID and Parent PID of a child process, we can devise the following Splunk search query for detection.
|
sourcetype="test-xml" "Event.System.EventID"=1 | eval Parent_ProcessId=mvindex('Event.EventData.Data', 3) | eval Process_Name=mvindex('Event.EventData.Data', 10) | eval Result=if('Event.System.Execution{@ProcessID}'=Parent_ProcessId, "Not Suspicious","Suspicious") | table Process_Name, Result |
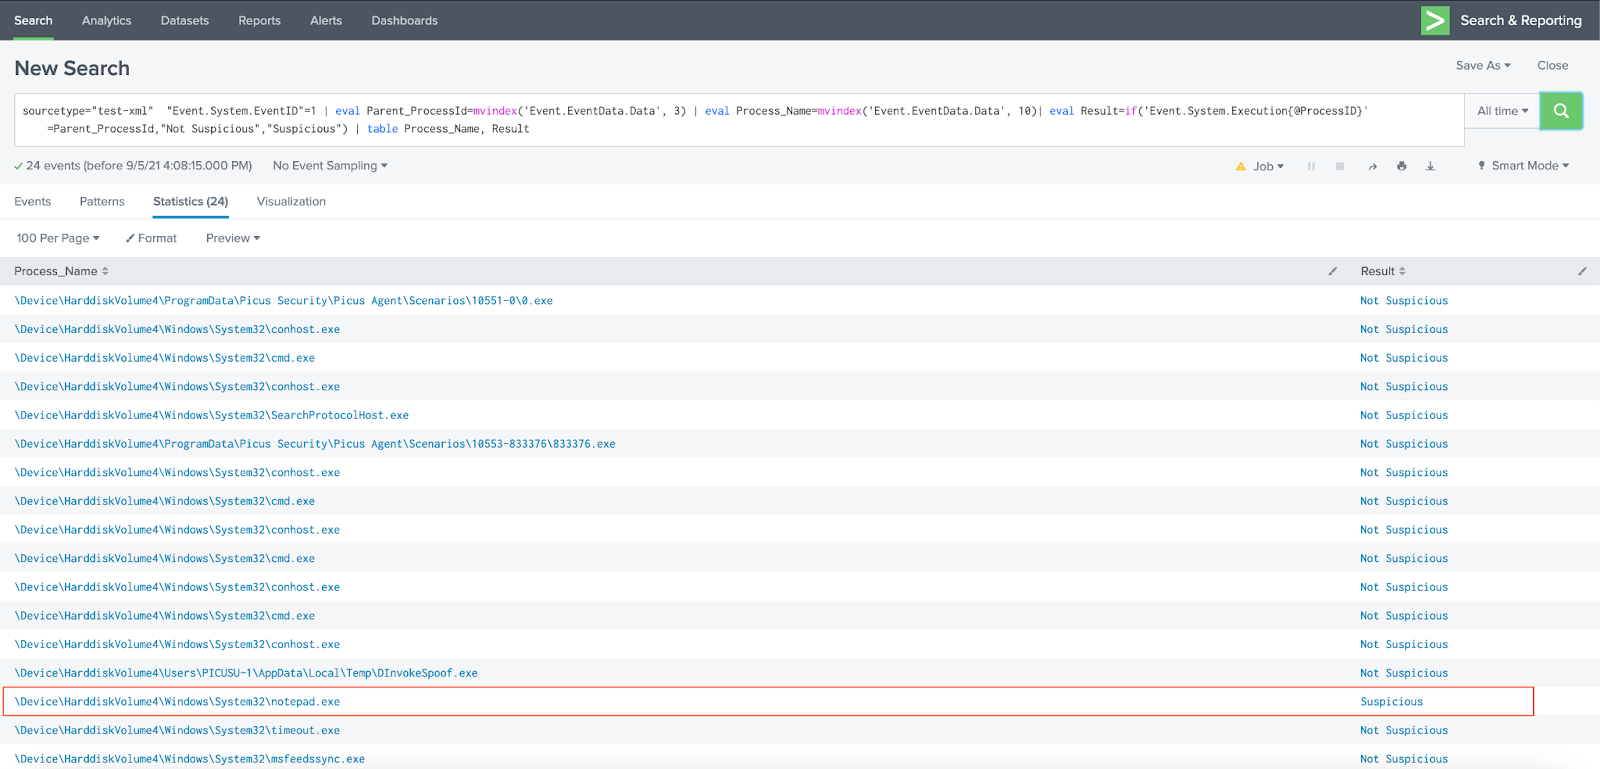
Figure 5: Parent Process ID Spoofing Detection with Splunk

References
[1] “About Event Tracing.” [Online]. Available: https://docs.microsoft.com/en-us/windows/win32/etw/about-event-tracing.
[2] “How to: Use Performance Monitor to Collect Event Trace Data.” [Online]. Available: https://docs.microsoft.com/en-us/dynamics365/business-central/dev-itpro/administration/monitor-use-performance-monitor-collect-event-trace-data.
[3] “UpdateProcThreadAttribute function (processthreadsapi.h).” [Online]. Available: https://docs.microsoft.com/en-us/windows/win32/api/processthreadsapi/nf-processthreadsapi-updateprocthreadattribute.
[4] “Access Token Manipulation: Parent PID Spoofing.” [Online]. Available: https://attack.mitre.org/techniques/T1134/004/.
[5] decoder-it, “GitHub - decoder-it/psgetsystem: getsystem via parent process using ps1 & embedded c#” GitHub. [Online]. Available: https://github.com/decoder-it/psgetsystem.
![]()
![]()
![]()


.png?width=353&height=200&name=Ni8mare-ET-preview-oct25%20(1).png)