
Key Findings
- Volume vs. Capacity – Organizations face a 40% YoY increase in vulnerabilities (~135 new CVEs daily), yet the average enterprise only has the bandwidth to remediate 10–15% of its backlog per month.
- Vulnerability prioritization is the process of identifying which security vulnerabilities to fix first based on actual risk. Most teams solely rely on CVSS scores for prioritization.
- CVSS scores measure theoretical severity, not real-world exploitability — they don't know whether your controls actually block the exploit path. FIRST itself says base scores shouldn't be used alone for prioritization.
- EPSS adds exploitation likelihood but still can't see your environment — it predicts global trends, not whether your specific controls would stop the attack.
- Teams are patching the wrong things first — only 2.3% of CVSS 7+ vulnerabilities see actual exploitation attempts, while 28% of exploited CVEs carry only medium scores.
- Only control-validated prioritization closes the gap — matching CVEs against live control performance separates what's actually exploitable from what's theoretical. Blue Report shows only 14% of logged adversarial activity generates an alert.
- Automated pentesting validates attack paths but can't observe the defender — it proves exploitability for a subset but can't tell you which of the remaining 49,000 scanner findings your controls already block.
- Without cross-tool normalization, teams default back to CVSS — siloed outputs from pentesting, BAS, and scanners with no deduplication recreate the original problem.
- Picus closes the vulnerability prioritization gap — the Picus Platform matches scanner and pentesting findings against live security control performance, turning 50,000 theoretical vulnerabilities into a ranked, control-validated remediation queue based on actual exploitability in your environment.
- Teams running Picus consistently report 98% reduction in critical ticket backlog, 89% reduction in MTTR, 92% fewer SLA violations on high-severity findings – because they're finally fixing what would actually be exploited first.
What Is Vulnerability Prioritization?
Vulnerability prioritization is the process of evaluating and ranking discovered security vulnerabilities based on the actual risk they pose to a specific environment — combining exploitability, asset exposure, and business context to determine which issues to fix first.
Rather than treating every high-severity finding as equally urgent, effective vulnerability prioritization separates what's theoretically dangerous from what's genuinely exploitable given an organization's current controls, infrastructure, and threat landscape.
The Vulnerability Prioritization Gap: 50,000 Findings, One Question
Your vulnerability scanner just returned 50,000 findings. CVSS says 300 of them are Critical. Your vulnerability management team has the bandwidth to remediate maybe 15% this month.
So the question that decides whether your next quarter is a firefight or a focused campaign comes down to this: which of those 300 are actually exploitable in your environment?
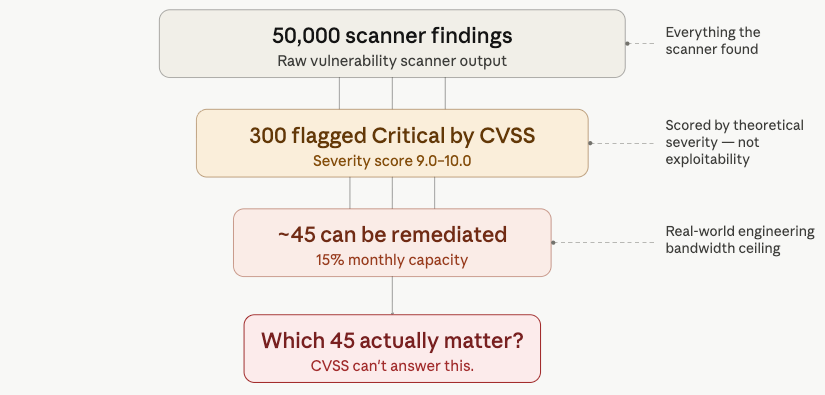
Figure 1. Funnel showing 50,000 scanner findings narrowing to 300 CVSS Critical to ~45 fixable, asking which ones actually matter.
CVSS can't answer that question. It was never designed to.
And yet, in most organizations, CVSS scores remain the primary, sometimes only, input driving vulnerability prioritization. The result is a gap that burns engineering hours on theoretical risks while genuinely exploitable exposures sit untouched in the backlog. Not a tooling deficiency. A structural one.
Common Vulnerability Scoring System (CVSS) Explained
The Common Vulnerability Scoring System (CVSS) is an open framework maintained by FIRST that rates the severity of security vulnerabilities on a 0–10 scale. Scores are calculated based on intrinsic characteristics like attack vector, complexity, privileges required, and potential impact, independent of any specific environment or deployed defenses.
Why CVSS Scores Still Dominate Vulnerability Prioritization
CVSS became the default vulnerability prioritization framework for good reason. It's standardized, widely understood, and embedded in virtually every scanner, ticketing system, and compliance workflow in existence.
When your auditor asks how you prioritize vulnerabilities, "we follow CVSS" is the answer that doesn't require a follow-up conversation. Compliance frameworks like PCI DSS, HIPAA, and NIST guidelines all reference CVSS to define thresholds for acceptable risk and required remediation timelines.
But CVSS was designed to score the intrinsic severity of a vulnerability; how bad it could be in the worst case, in a vacuum.
|
Even FIRST, the organization that maintains CVSS, explicitly states that base scores should not be used alone for prioritization. |
- CVSS doesn't factor in your environment.
- It doesn't know whether your firewall blocks the exploit path.
- It doesn't know whether your EDR catches the lateral movement technique that chains a medium-severity CVE into a critical attack path.
- It doesn't know whether a compensating control actually compensates.
|
A CVSS 9.8 sitting behind a properly configured WAF that blocks the exploit vector is, operationally, a lower priority than a CVSS 6.5 with a detection rule that hasn't fired in months and no compensating control in sight. But your scanner can't tell you that. Your remediation queue treats them both as numbers, and the 9.8 wins every time. |
This is the vulnerability prioritization gap, and it's wider than most teams realize.
The Numbers That Expose the Vulnerability Prioritization Problem
The scale of vulnerability disclosure makes the prioritization gap worse, not better.
- Organizations face ~135 new CVEs per day — a 40% year-on-year increase
- Over 48,000 new CVEs were published in 2025 alone
- Mean time to remediate ranges from 55 to 72 days
- During that window, thousands of additional CVEs get published
- The average enterprise remediates only 10–15% of its vulnerabilities per month
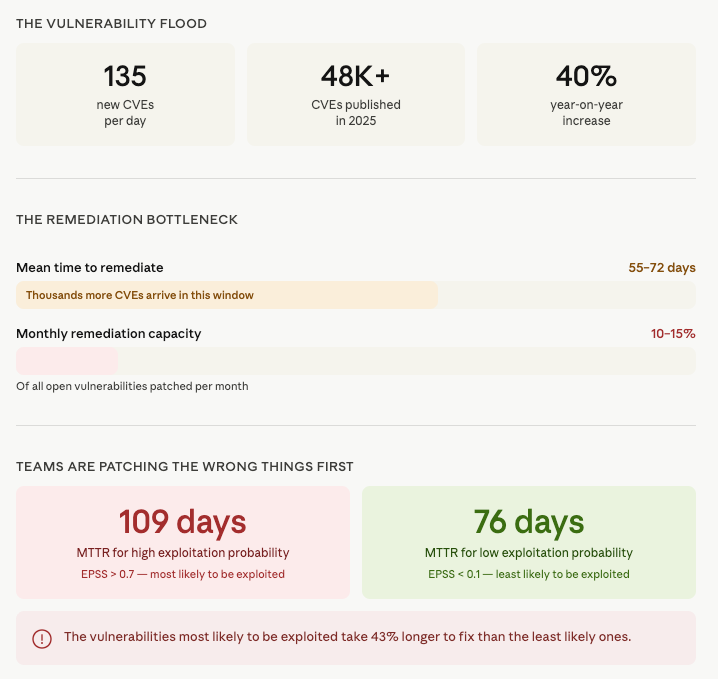
Figure 2. Vulnerability Flood Metrics: # of CVEs per day, MTTR, Remediation Capatity
Those numbers alone would strain any team.
But here's where the gap turns from inconvenient to dangerous: research shows that vulnerabilities with a high probability of exploitation (EPSS > 0.7) actually carry a higher average remediation time (109 days) than those with low exploitation probability, which get fixed in about 76 days.
Teams are frequently patching the wrong things first, not because they don't care, but because the vulnerability prioritization inputs they're using don't reflect actual risk.
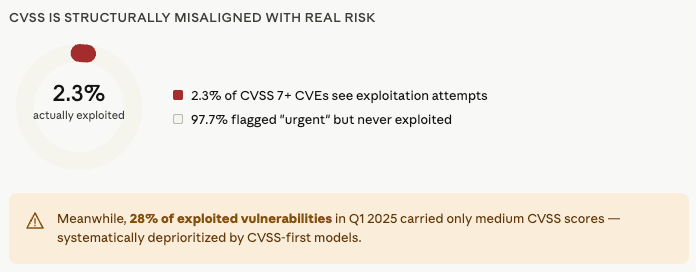
Figure 3. CVSS Is Structurally Misaligned with Real Risk
Meanwhile, FIRST's own research found that of all CVEs scored CVSS 7 or higher — the threshold most organizations use to define urgent remediation — only about 2.3% were actually observed in exploitation attempts over a given month.
And in Q1 2025, 28% of exploited vulnerabilities carried only medium CVSS base scores. Organizations using a CVSS-first prioritization model are systematically deprioritizing more than a quarter of the vulnerabilities that attackers are actually using.
CVSS tells you "this is severe." It doesn't tell you "this is exploitable in your environment, given your current controls." That second question is the only one that matters for operational vulnerability prioritization.
The Exploit Prediction Scoring System (EPSS) Explained
The Exploit Prediction Scoring System (EPSS) is a data-driven model maintained by FIRST that estimates the probability a given vulnerability will be exploited in the wild within the next 30 days. Unlike CVSS, which measures how severe a vulnerability could be, EPSS measures how likely it is to actually be exploited — based on real-world threat activity and historical patterns.
Why EPSS Alone Doesn't Close the Gap
The Exploit Prediction Scoring System was a meaningful step forward. By estimating the probability that a vulnerability will be exploited in the wild within 30 days, EPSS adds a real-world likelihood dimension that CVSS lacks entirely.
Combining EPSS and CVSS with the CISA KEV catalog can reduce urgent prioritization workload by as much as 95%.
But EPSS is still a global prediction, not a local assessment. It tells you what's being exploited across the internet. It doesn't tell you whether your specific security controls would stop that exploit if it hit your infrastructure.
The missing layer in vulnerability prioritization isn't better scoring. It's live security control performance data, matched against the specific vulnerabilities in the specific environment being defended.
What Control-Validated Vulnerability Prioritization Actually Looks Like
Control-validated prioritization is the practice of testing vulnerability findings against your live security controls, firewalls, EDR, SIEM rules, WAFs, to determine which exposures are actually exploitable in your specific environment before deciding remediation order.
Instead of ranking vulnerabilities by severity scores alone, you validate whether your existing defenses would actually stop the associated exploit technique.
This means testing both prevention controls (firewalls, WAFs, IPS, endpoint protection) and detection controls (SIEM rules, EDR alerting, response playbooks) against real threat behaviors.
The outcome falls into one of three categories:
- Blocked. Your control stops the exploit path. The vulnerability gets deprioritized — not ignored, but moved behind exposures with no compensating defense. A CVSS 9.8 behind a validated WAF rule ranks below a CVSS 6.5 with nothing protecting it.
- Exploitable. Your control doesn't stop it. The vulnerability is confirmed exploitable in your environment and moves to the top of the queue with evidence, not just a score.
- Silent failure. The detection rule exists but doesn't fire under real conditions. This is the blindspot most teams don't know they have. The Blue Report 2025 found that only 14% of logged adversarial activity actually generates an alert.
The result isn't a longer remediation list. It's a shorter, evidence-backed one; where thousands of theoretical scanner findings collapse into a ranked queue based on what would actually succeed against your defenses today.
Why Automated Pentesting Alone Can't Solve Vulnerability Prioritization
Automated pentesting tools validate exploit paths; they prove an attacker can get from point A to point B. That's valuable.
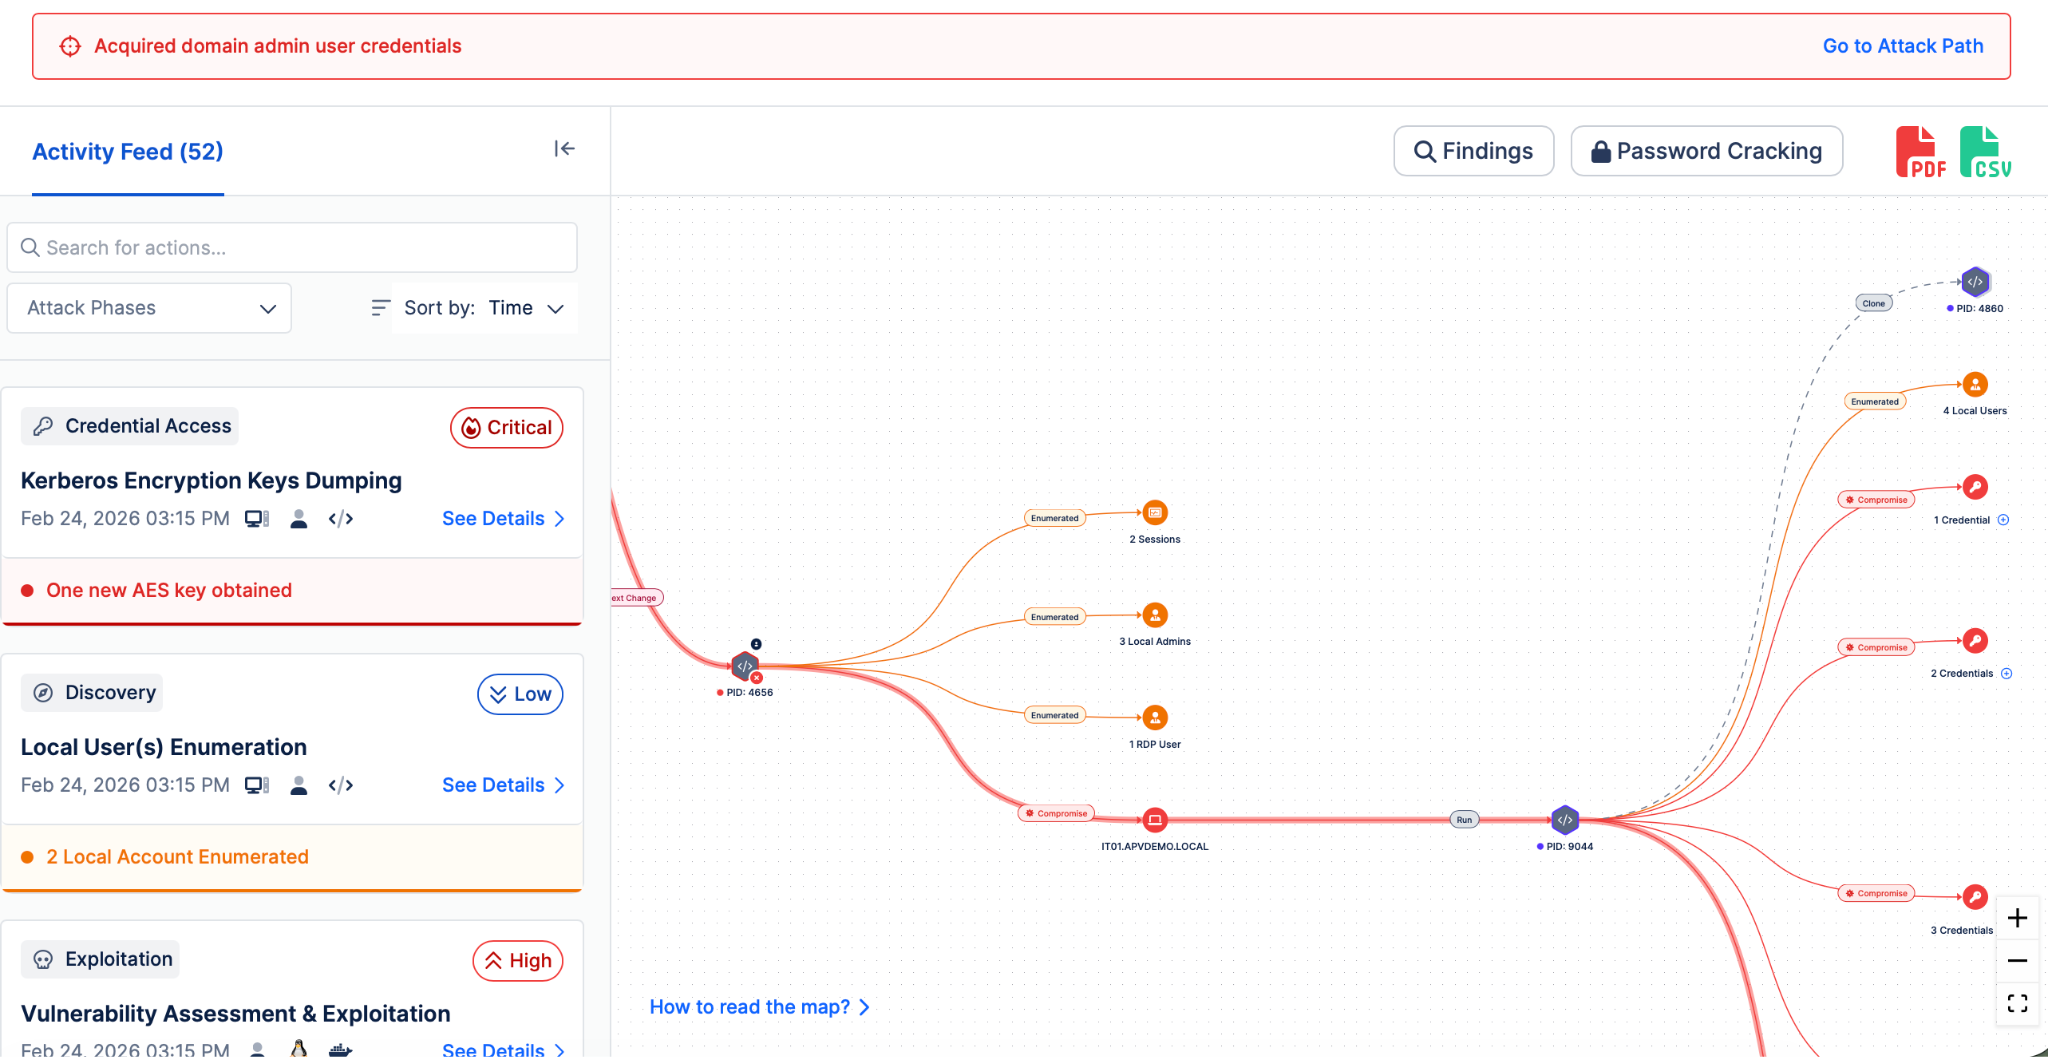
Figure 5. Automated Penetration Testing Works In a Directional Map
But automated pentesting operates from the attacker's perspective.
- It doesn't have visibility into whether your SIEM fired,
- whether your EDR caught the technique, or
- whether an alert reached an analyst.
It proves the path exists. It can't observe the defender.
This creates a paradox for VM teams relying on automated pentesting to prioritize: the tool validates a subset of exploitable vulnerabilities, but it can't tell you which of the remaining 49,000 scanner findings are blocked by working controls and which are genuinely unprotected. And because automated pentesting operates within a fixed scope — typically infrastructure and network attack paths — it can't validate vulnerabilities across your detection stack, cloud configurations, identity controls, or AI guardrails.
The vulnerability prioritization gap doesn't shrink by adding more offensive validation alone. It shrinks when offensive findings, scanner data, and defensive control performance data converge into a single normalized view.
The Normalization Problem: When Your Tools Don't Talk to Each Other
Even organizations that run automated pentesting, BAS, and vulnerability scanners face a second-order problem: the outputs live in silos.
Automated pentesting returns 100 validated exploits. The scanner returns 50,000 theoretical findings. BAS returns control gap data. The same vulnerability might appear in all three; reported differently, scored differently, with no deduplication.
Without a normalization layer that merges and re-prioritizes findings across all sources against live control performance, most teams default to the scanner's CVSS ranking because it's the only queue that covers everything — which puts them right back where they started.
How to Build a Risk-Based Vulnerability Prioritization Model That Works in 5 Steps
The frameworks above exposed the gap. This section closes it with a practical model your team can implement — regardless of which tools you run today.
Step 1: Establish Your Asset Context Layer
Prioritization without asset context is guesswork at scale. Before touching a single CVE, build a living inventory that classifies every asset by three dimensions:
Business criticality. A vulnerable print server and a vulnerable payment processing node may carry identical CVSS scores. Their remediation urgency is not identical. Map every asset to the business function it supports, the data it processes, and the blast radius if compromised. An exploitable path to a development sandbox is a different conversation than one that reaches a database holding customer PII.
Exposure posture.
- Is the asset internet-facing, internal-only, or air-gapped?
- Does it sit behind a load balancer with WAF enforcement, or is it directly addressable?
Two identical CVEs on two identical OS versions carry fundamentally different risk profiles depending on how many controls stand between the vulnerability and an attacker's initial access point.
Ownership and remediation velocity. A critical finding assigned to a team with a 72-hour SLA and direct deployment access is operationally different from one routed to a team managing change windows three weeks out. Your prioritization model should account for who can act, not just what needs action.
Step 2: Layer Exploitability Evidence Over Severity Scores
CVSS and EPSS belong in the model — as inputs, not as the model itself. Layer them with three additional data sources that move prioritization from theoretical to empirical.
Known exploitation status. Cross-reference every finding against the CISA Known Exploited Vulnerabilities (KEV) catalog, vendor advisories, and threat intelligence feeds. A CVE actively exploited in the wild with a public proof-of-concept demands different handling than one with no observed activity and high attack complexity.
Attack path reachability. Use automated pentesting data to determine which vulnerabilities actually chain into viable paths from initial access to critical assets. A CVSS 8.1 that requires local access on a segmented VLAN with no inbound route is not the same risk as a CVSS 6.8 that chains with a misconfigured service account to reach domain admin. Exploitability isn't a property of the vulnerability alone — it's a property of the vulnerability in your topology.
Control effectiveness evidence. This is the layer most models skip entirely. For each vulnerability, determine whether your deployed controls — firewall rules, IPS signatures, EDR policies, SIEM detection logic — actually block or detect the associated exploit technique under real conditions. Not configured-to-block. Validated-as-blocking. The difference between those two states is where silent failures live.
Step 3: Build Composite Risk Scores, Not Single-Axis Rankings
With asset context, exploitability evidence, and control performance data in hand, construct a composite score that weights multiple dimensions rather than defaulting to CVSS alone.
A practical composite model evaluates each vulnerability across four axes:
- Severity (CVSS base + temporal metrics) — how damaging could exploitation be?
- Likelihood (EPSS + KEV + threat intel) — how probable is exploitation in the wild?
- Reachability (attack path validation + network topology) — can an attacker actually reach this vulnerability given your architecture?
- Defensive coverage (control validation results) — do your existing defenses stop the associated technique, or does it pass through undetected?
A vulnerability scoring high on severity and likelihood but low on reachability and with validated defensive coverage drops in the queue. One scoring moderate on severity but high on likelihood with zero defensive coverage jumps ahead. The math can be weighted to match your organization's risk appetite — the critical shift is that no single axis dominates.
Step 4: Normalize Across All Finding Sources
Your scanner, your pentesting tool, and your BAS platform each see the environment through a different lens. The composite score only works if it's applied to a deduplicated, normalized dataset — not three separate queues each using their own taxonomy.
Normalization requires three operations most teams underestimate:
Deduplication by root cause, not by tool output. The same misconfigured SSH service might appear as a CVE in your scanner, an exploited credential pivot in your pentesting results, and a failed prevention control in your BAS findings. That's one remediation action, not three tickets.
Enrichment across sources. A scanner finding gains context when matched against pentesting results that confirm reachability, and BAS results that confirm whether controls catch the technique. Each source enriches the others — but only if the data is merged before scoring.
Re-ranking against live control state. Static prioritization decays. Controls drift, configurations change, new attack techniques emerge. The model must re-evaluate priority as control validation data refreshes — not once a quarter when the pentest report arrives, but continuously as your defensive posture evolves.
Step 5: Operationalize With Closed-Loop Verification
A prioritized list that doesn't connect to remediation workflows is a report, not a program. The final step ties the model to action.
Route validated, prioritized findings directly into your existing ticketing and orchestration tools with enough context for the receiving team to act without a follow-up meeting. That means the specific vulnerability, the specific asset, the specific control gap, and the specific remediation step — not a PDF summary attached to a Jira ticket.
After remediation, re-validate. A closed ticket is not a closed gap. The only proof that a fix worked is a subsequent test confirming the exploit technique no longer succeeds and the detection rule now fires. Without re-validation, your model accumulates assumed closures that silently reopen the prioritization gap you just spent months closing.
Close the Vulnerability Prioritization Gap with the Picus Platform
The Picus Platform was built for exactly this problem.
Instead of forcing VM teams to prioritize on theoretical severity alone, Picus matches vulnerability data against live security control performance across your actual environment, turning 50,000 scanner findings into a ranked, control-validated action queue you can defend.
Picus ingests findings from your existing vulnerability scanners and automated pentesting tools, then runs them through a security data fabric that unifies asset intelligence, exposure data, and real-time control effectiveness.
|
The result: every finding scored by actual exploitability in your environment, not just CVSS severity. Theoretical CVEs become confirmed exploitable exposures, or get deprioritized with evidence. The Picus Score combines CVSS, EPSS, and KEV data with real-world exploitability proof and your specific asset and business context, so your remediation queue reflects what actually matters. |
With vendor-specific remediation guidance for every validated exposure and automatic re-validation after fixes are deployed, Picus closes the loop from finding to fix to proof.
Teams running Picus consistently report 98% reduction in critical ticket backlog, 89% reduction in MTTR, 92% fewer SLA violations on high-severity findings; because they're finally fixing what would actually be exploited first.
Request a Demo → See how Picus turns vulnerability noise into a prioritized, control-validated remediation queue.



.png?width=353&height=200&name=Picus-Frost%26sullivan-Awards-preview-april22%20(1).png)

.png?width=353&height=200&name=picus-cyber-fundamentals-6surfaces-validation-preview-april8%20(2).png)
.png?width=353&height=200&name=picus-cyber-fundamentals-6surfaces-validation-preview-april8%20(1).png)